

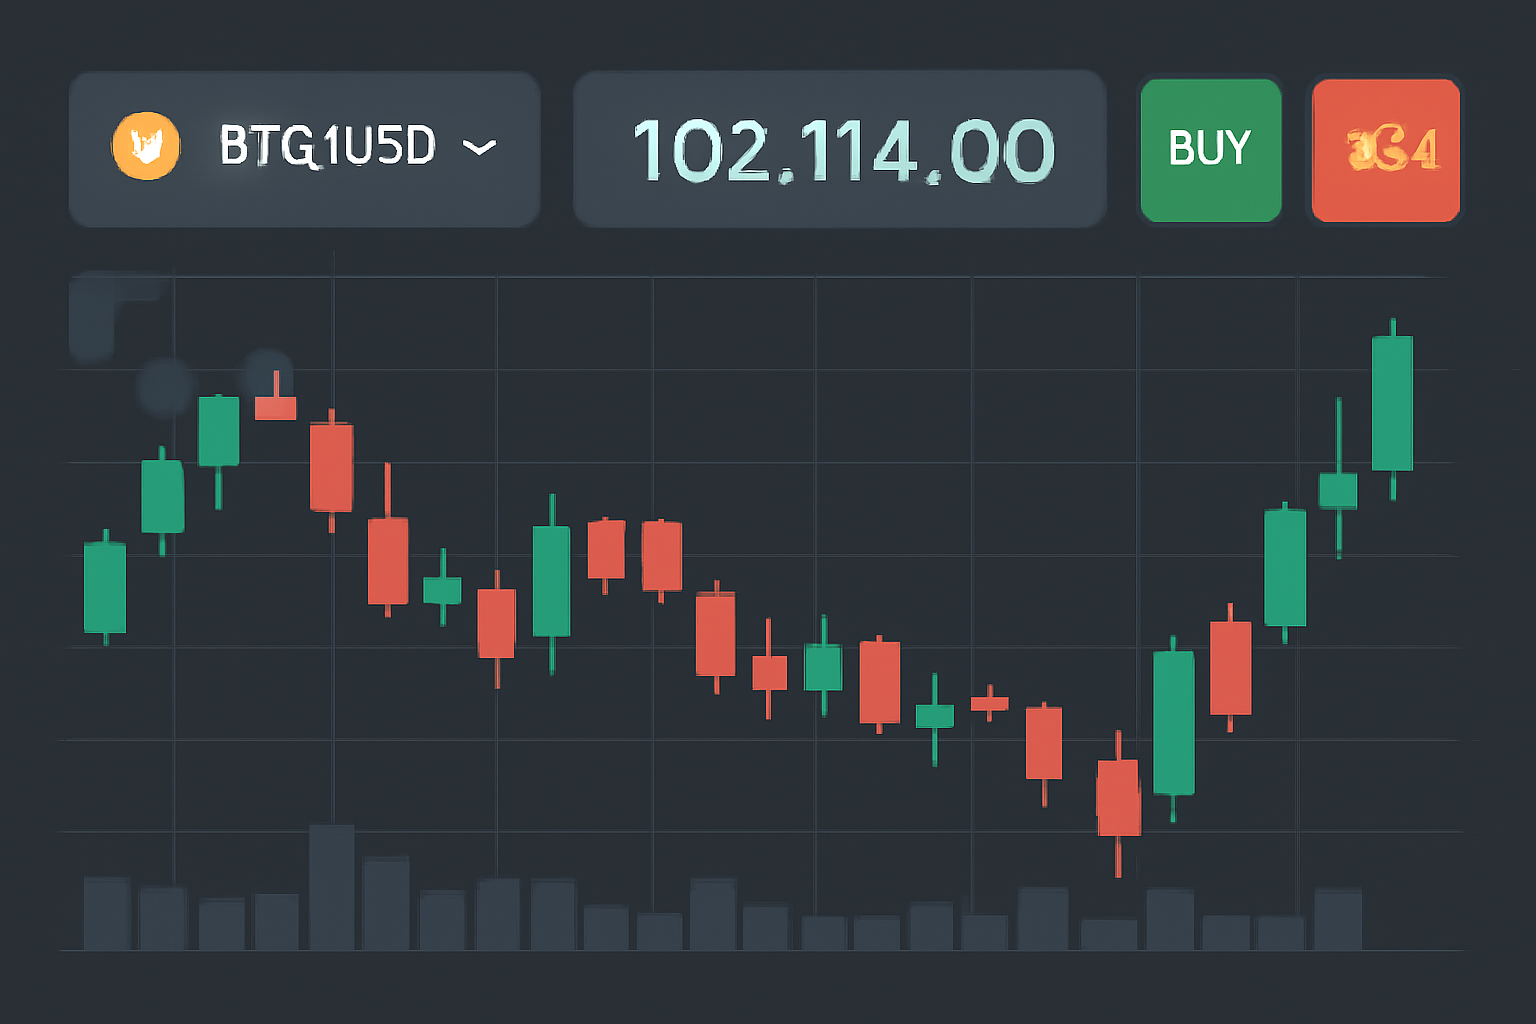
In the rapidly evolving landscape of crypto trading, 2025 has seen Fair Value Gap (FVG) strategies rise to prominence among both institutional and retail traders. With Bitcoin (BTC) currently priced at $102,114.00, down 1.31% on the day, and Ethereum (ETH) at $3,426.55, the hunt for high-probability setups is more competitive than ever. FVGs offer a unique edge by highlighting where price action has moved too quickly, leaving behind imbalances that often attract smart money flows.
What Is a Fair Value Gap in Crypto Trading?
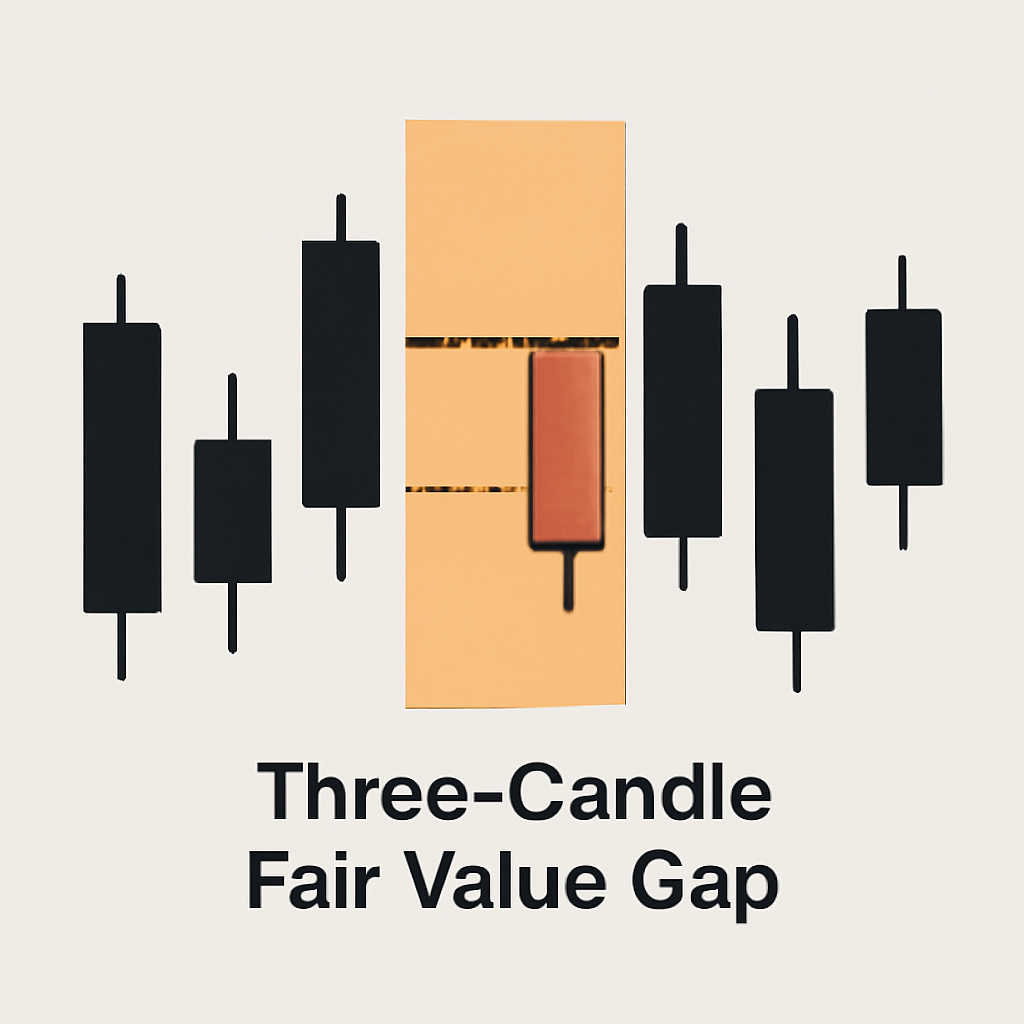
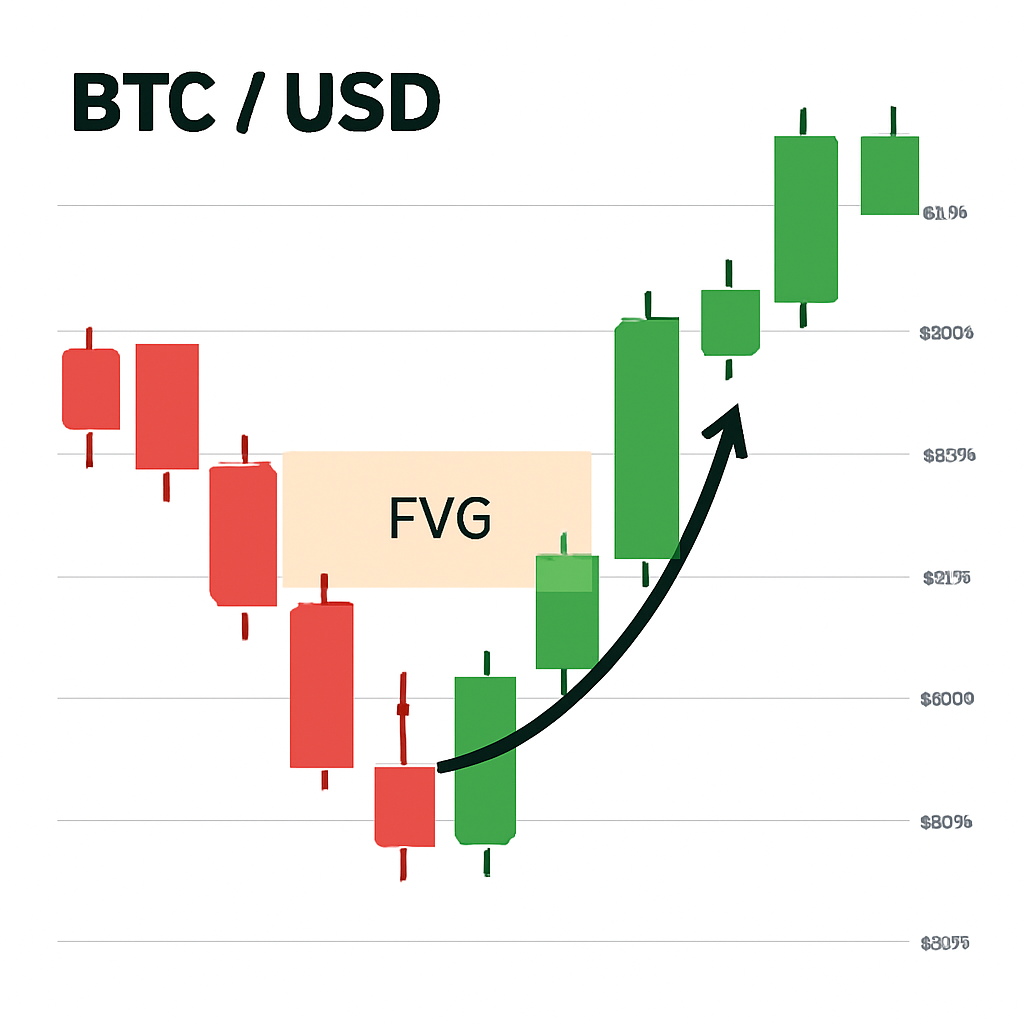
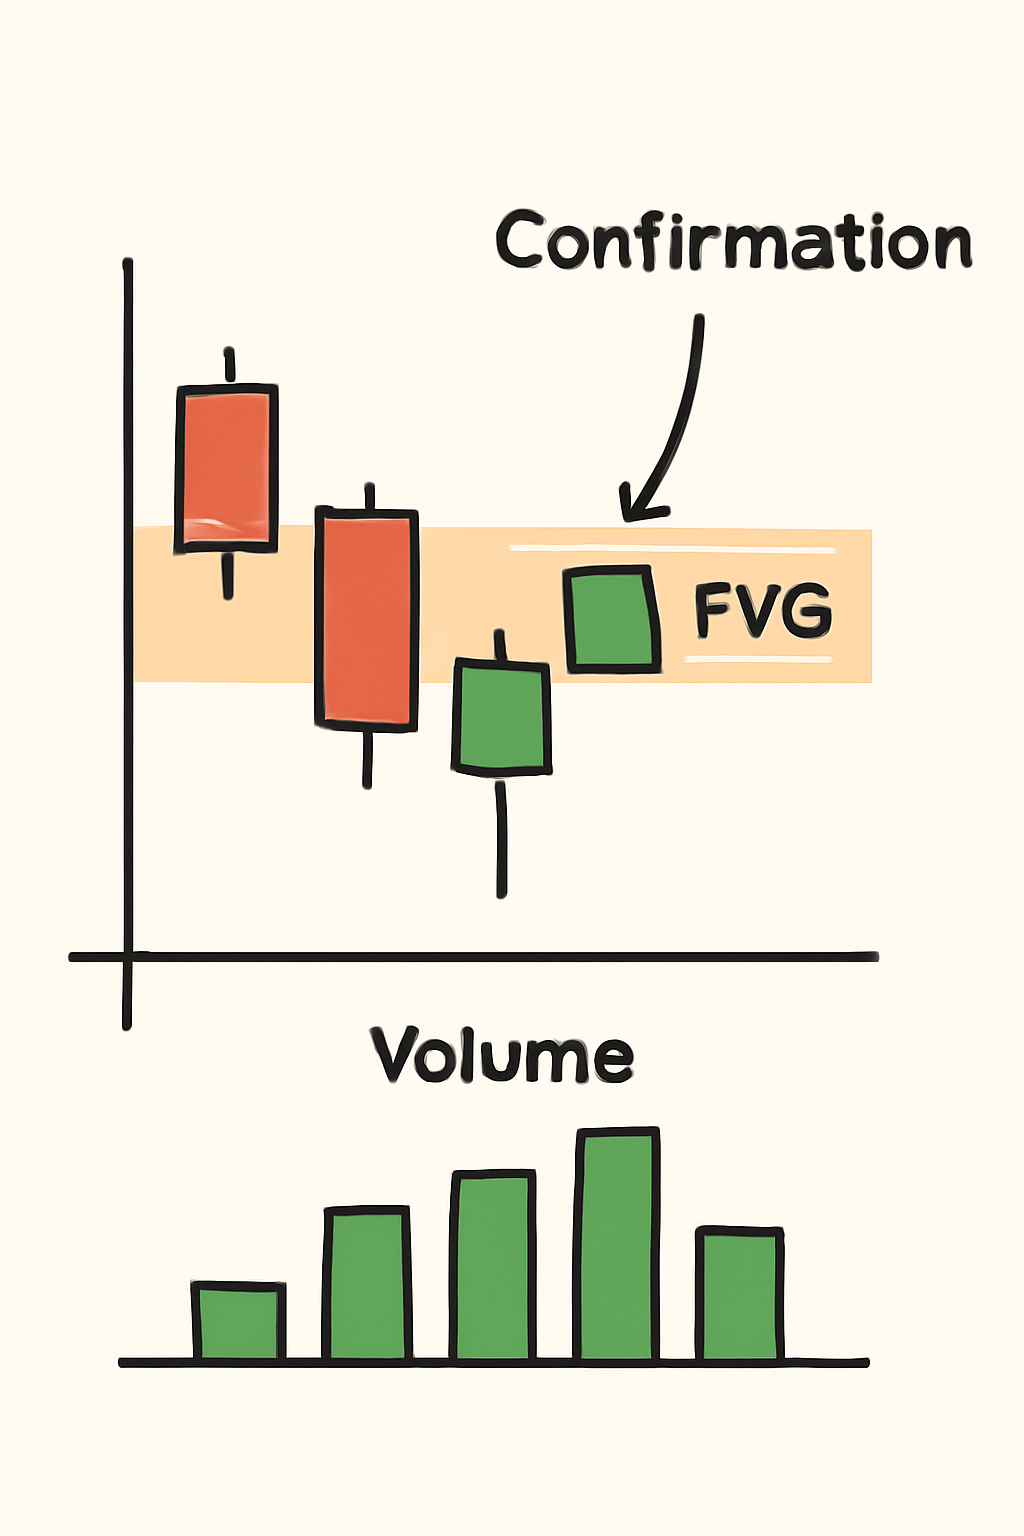
A Fair Value Gap represents a zone on a price chart where an asset's value moves so rapidly that little or no trading occurs within that range. This creates an imbalance between buyers and sellers - a vacuum that price often revisits before resuming its trend. In practical terms, FVGs are identified using a three-candle pattern: look for a large momentum candle flanked by smaller candles whose wicks do not overlap with the central candle's body. Bullish FVGs point upward and act as support; bearish FVGs point downward and serve as resistance.
This technical concept has been widely adopted in crypto due to its effectiveness in volatile markets like Bitcoin and Ethereum, where sudden surges or drops are common. The ability to spot these gaps can mean the difference between catching a major move or missing out entirely.
Spotting High-Probability Setups: How to Identify FVGs
The key to successful fair value gap crypto strategy 2025 is precision in identification:
- Three-Candle Pattern: The classic method involves spotting a large momentum candle with non-overlapping wicks from adjacent candles.
- Volume Analysis: High volume accompanying the gap often signals institutional involvement.
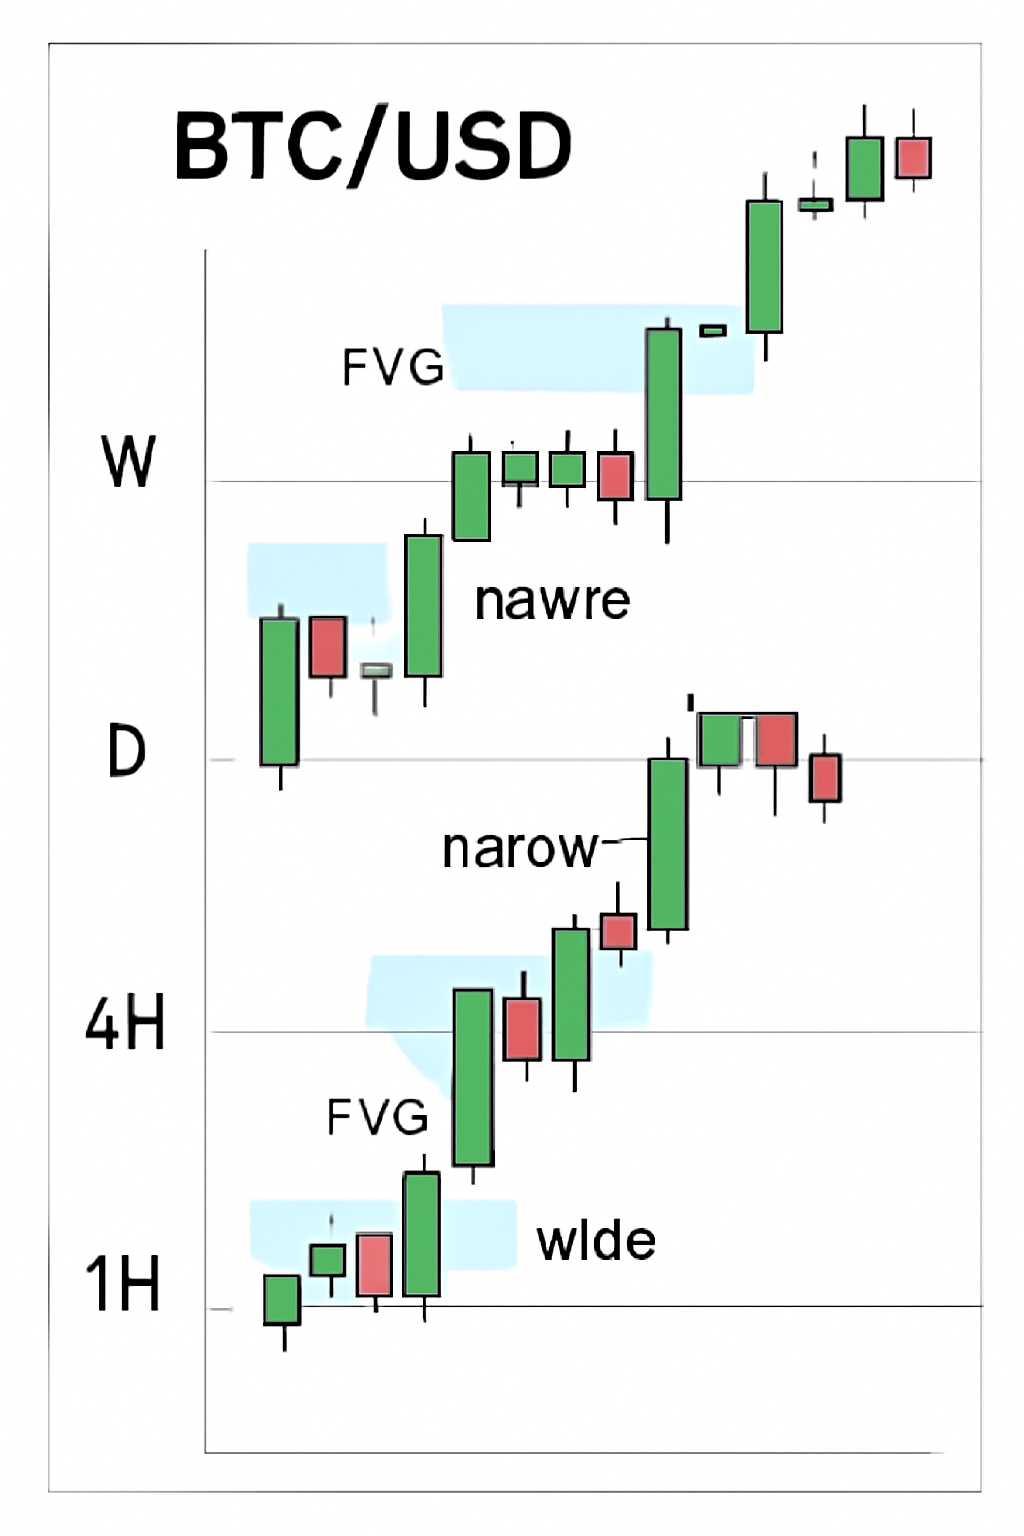
- Multi-Timeframe Confirmation: Gaps visible on both higher and lower timeframes carry more weight.
A growing number of traders now use automated scanners or advanced charting tools to highlight these zones in real-time, but manual confirmation remains vital for accuracy.
"FVGs aren’t just technical quirks - they’re footprints left by aggressive market participants. Learning to read them is like learning to read the market’s mind. "
Tactical Approaches: Entry Signals and Risk Management Using FVGs
The most common way to trade an FVG is through an entry on gap retrace. Here’s how it typically works:
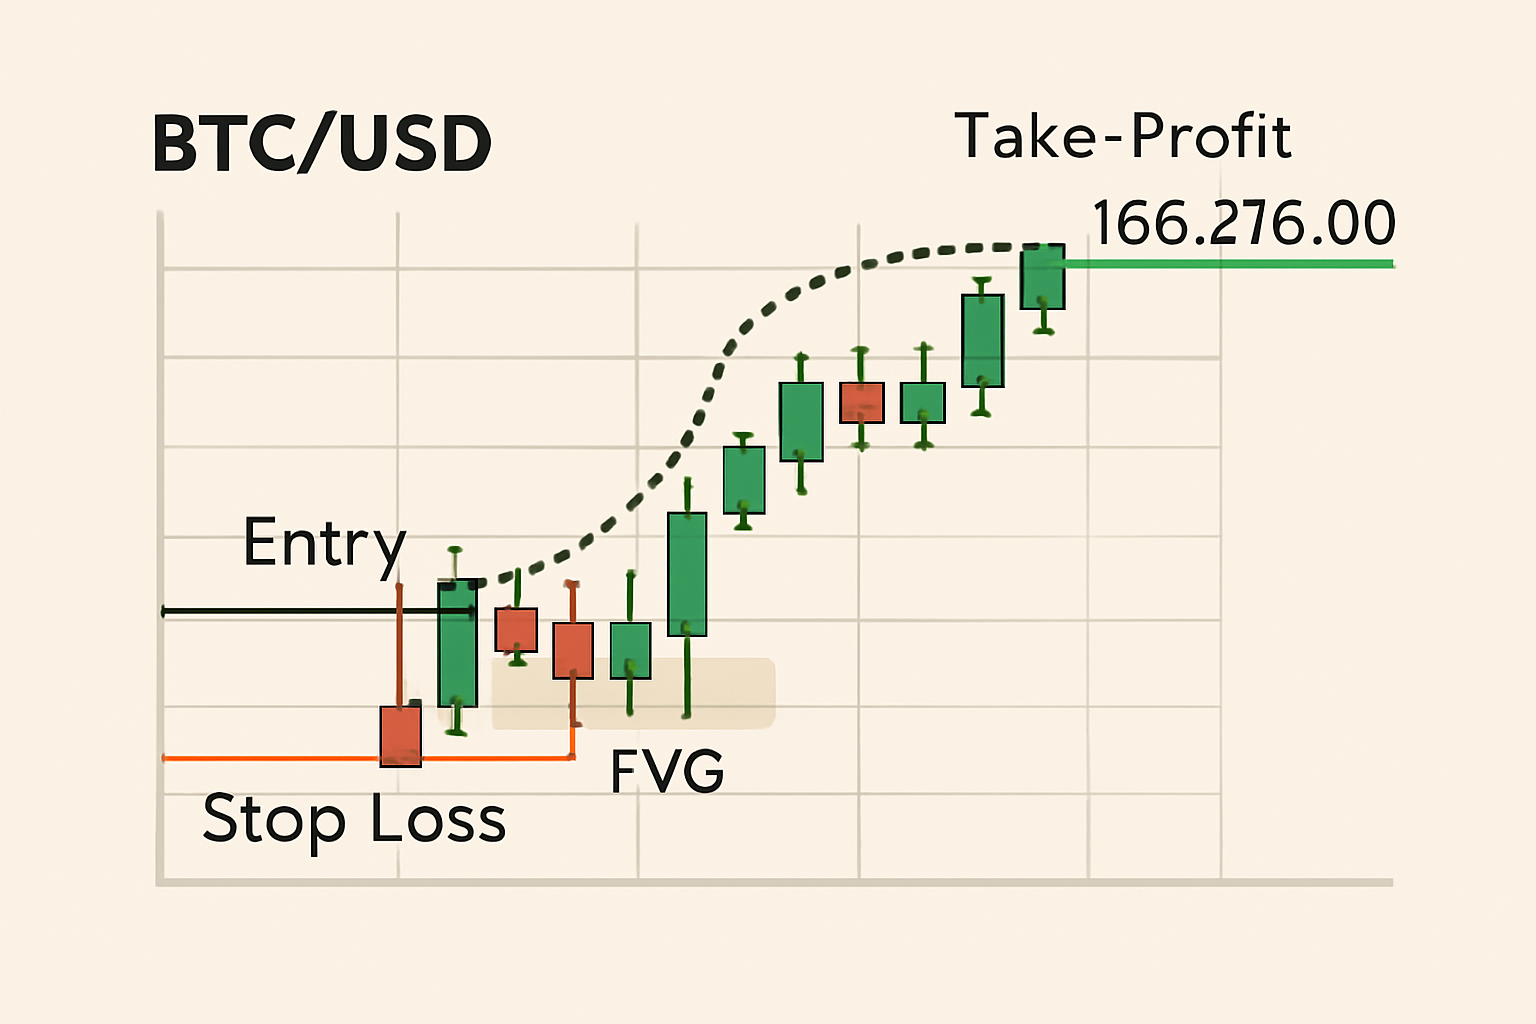
- Wait for Retrace: After identifying an FVG, wait for price to return into the gap zone.
- Directional Entry: Enter long on bullish gaps (support), short on bearish gaps (resistance).
- Use Confirmation: Look for candlestick patterns such as hammers or engulfing formations inside the gap; volume spikes or RSI divergences can provide additional conviction.
- Tight Stop-Losses: Place stops just beyond the gap’s boundary to limit downside risk if price fails to respect the zone.
This disciplined approach helps filter out false signals - especially important in choppy markets like we’ve seen around Bitcoin’s $102,114 level in November 2025.
Step-by-Step Guide: Identifying & Trading Fair Value Gaps on BTC/USD Charts (2025)
The Macro View: Why FVG Strategies Matter More Than Ever in Late 2025
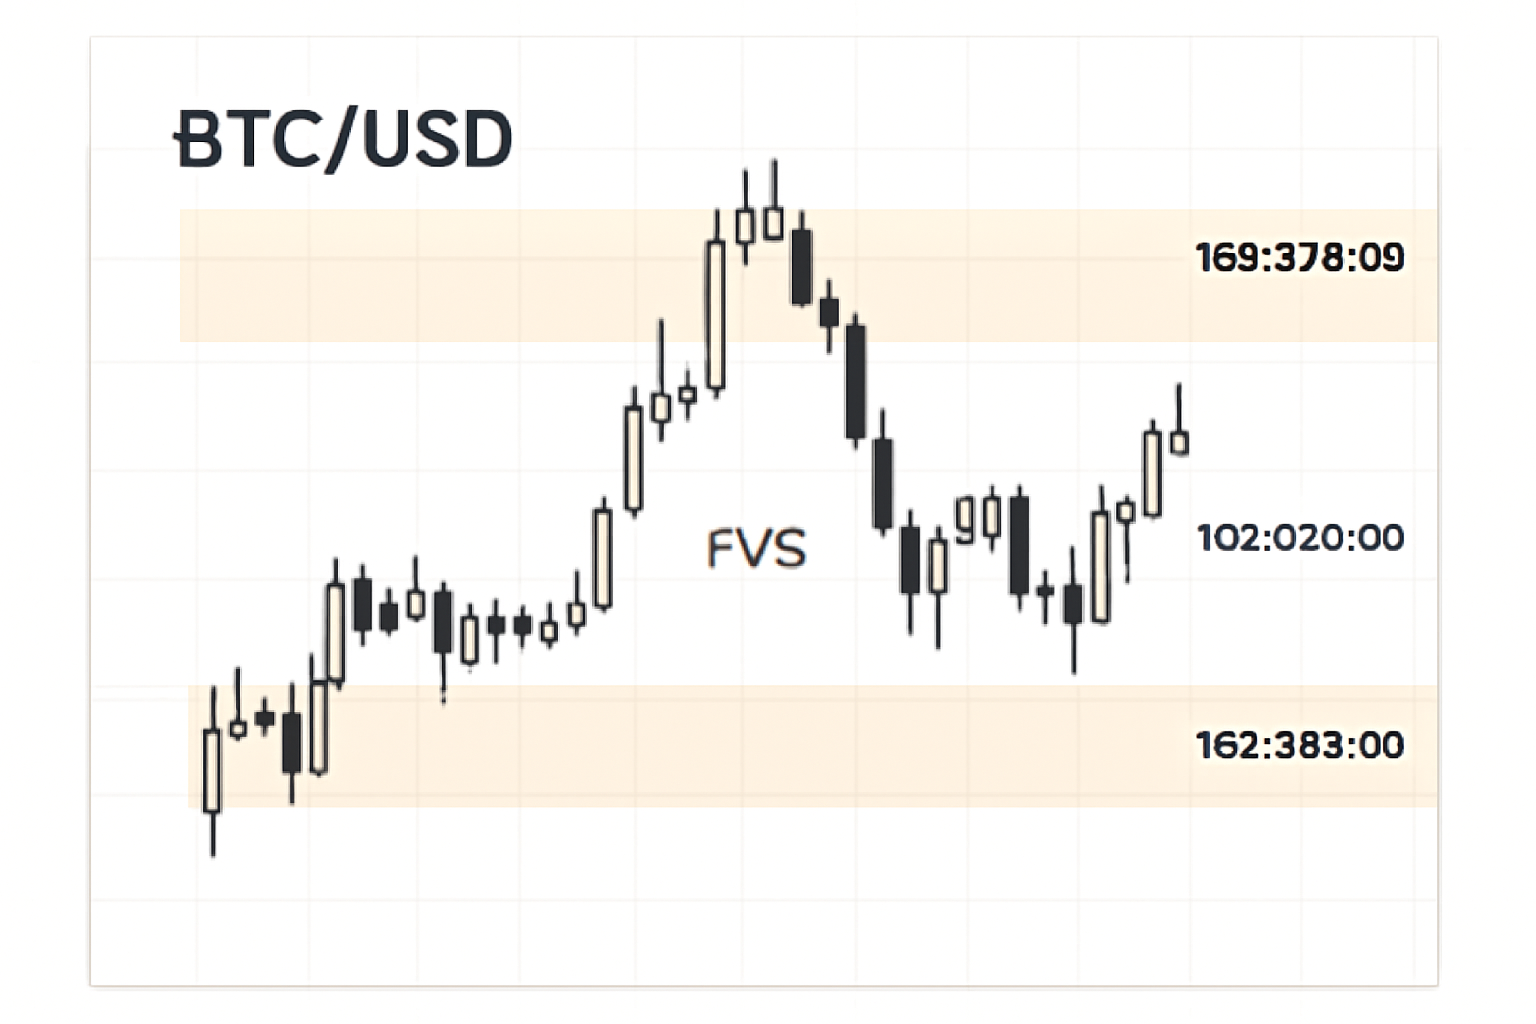
The current consolidation phase around $100,000 and BTC is creating fresh fair value gaps almost daily. With increased institutional participation and algorithmic trading dominating order books, recognizing these imbalances gives retail traders a fighting chance against larger players. Moreover, stacking multiple FVGs in one direction can signal powerful trend continuation - while wider gaps often indicate higher-probability zones worth watching closely.
Bitcoin (BTC) Price Prediction 2026-2031 Based on Fair Value Gap Analysis
Forecasts leverage current FVG levels, market trends, and adoption cycles to project BTC price ranges under varying market scenarios.
| Year | Minimum Price (Bearish Scenario) | Average Price (Baseline) | Maximum Price (Bullish Scenario) | % Change (Avg YoY) | Market Scenario Insights |
|---|---|---|---|---|---|
| 2026 | $85,000 | $110,000 | $145,000 | +7.7% | Potential retrace to FVG support ($102k), mild regulatory headwinds, steady institutional adoption |
| 2027 | $95,000 | $124,000 | $170,000 | +12.7% | Recovery and growth as FVGs act as launchpads, possible ETF inflows, wider merchant acceptance |
| 2028 | $105,000 | $140,000 | $200,000 | +12.9% | Bullish halving cycle impact, improved scalability, increasing global recognition |
| 2029 | $120,000 | $158,000 | $235,000 | +12.9% | Sustained adoption, new use cases, potential for regulatory clarity, increased competition from altcoins |
| 2030 | $135,000 | $180,000 | $275,000 | +13.9% | Wider institutional and retail adoption, macroeconomic shifts, integration with financial systems |
| 2031 | $150,000 | $205,000 | $320,000 | +13.9% | Peak adoption phase, possible technological breakthroughs, potential for market exuberance |
Price Prediction Summary
Bitcoin's price outlook from 2026 to 2031 shows a steady upward trajectory, rooted in current FVG levels and historical market cycles. While short-term volatility and retracements to FVG support levels may occur, the long-term trend suggests higher highs, especially as institutional adoption and technological improvements accelerate. Bullish scenarios see BTC reaching over $300,000 by 2031, while bearish cases imply robust support above $85,000, reflecting crypto's growing maturity.
Key Factors Affecting Bitcoin Price
- Significance of $102,114 FVG as a key support/resistance zone influencing price retracements and trend continuation.
- Market cycles, especially Bitcoin halving events (next in 2028), historically drive major price surges.
- Regulatory developments (e.g., ETF approvals, global policy shifts) can accelerate or dampen momentum.
- Technological upgrades (e.g., Layer 2 scaling, security enhancements) may drive adoption and price appreciation.
- Macro-economic factors (inflation, global liquidity, fiat instability) can impact demand for BTC as a store of value.
- Competition from ETH and other smart contract platforms may influence BTC's dominance and capital flows.
Disclaimer: Cryptocurrency price predictions are speculative and based on current market analysis. Actual prices may vary significantly due to market volatility, regulatory changes, and other factors. Always do your own research before making investment decisions.
For traders looking to build a robust edge, integrating FVG analysis with other tools, such as order blocks or liquidity pools, can further refine entries and exits. The interplay between FVGs and these institutional concepts has become a cornerstone of advanced crypto trading strategies in 2025. As volatility persists, the ability to quickly adapt to new gap formations is critical for both short-term scalpers and swing traders alike.
Consider this: when Bitcoin dipped to its intraday low of $102,080 before rebounding, several micro fair value gaps formed on the lower timeframes. Savvy traders who identified these zones were able to position themselves for the subsequent bounce back toward $102,114. The lesson? In fast-moving markets, FVGs often act as magnets for price, providing both opportunity and risk in equal measure.
Common Pitfalls When Trading Fair Value Gaps
While the allure of precision entries is strong, it’s important to recognize that not all gaps are created equal. Here are some frequent mistakes:
- Ignoring Market Context: Trading every FVG blindly without considering broader trend direction or macro news can lead to whipsaws.
- Overleveraging: Because FVG setups can look deceptively easy, traders sometimes use excessive leverage, only to get stopped out by routine volatility.
- Poor Risk Management: Not placing stop-losses outside the gap boundary exposes you to outsized losses if price fails to respect the zone.
The solution? Combine FVG signals with confluence factors like volume surges or RSI divergences. Always size positions appropriately relative to your account and market volatility.
Integrating FVGs With Broader Market Structure
The real power of fair value gap crypto strategy 2025 lies in using these imbalances as part of a bigger puzzle. For example, if an FVG aligns with a major order block or coincides with a key psychological level (like $100,000 on BTC), the odds of a successful trade increase dramatically. Multi-timeframe analysis is crucial here: an FVG visible on both the one-hour and daily chart carries far more weight than one seen only on five-minute candles.
If you’re interested in exploring how order blocks complement fair value gaps in live markets, check out our deep dive: How To Use Fair Value Gaps (FVG) And Order Blocks (OB) For Crypto Stock Trading Strategies.
Ultimately, staying nimble is essential. As Bitcoin hovers near $102,114, new gaps will continue to form, and fill, as liquidity ebbs and flows. By mastering the art of identifying high-probability zones and managing risk meticulously, traders can harness these imbalances for consistent gains even as macro trends shift beneath their feet.




No comments yet. Be the first to share your thoughts!