Retail FOMO, or the fear of missing out among everyday investors, has always been a powerful force in the crypto markets. In 2025, its influence on altcoin rallies is more pronounced and measurable than ever, thanks to real-time data from sources like Google Trends and blockchain analytics. As Bitcoin (BTC) holds steady at $110,670.00 and Ethereum (ETH) recently surged past $4,500, the rotation of capital from blue-chip coins into altcoins has set the stage for another explosive altseason. But is this a sign of lasting market resilience or a bubble alarm waiting to sound?

Retail FOMO Crypto: The Google Trends Signal

The clearest window into retail sentiment is often found not on the charts but in search engines. In August 2025, Google Trends data showed searches for “altcoin” hitting their highest point since 2020 (source). This spike was no coincidence; it directly coincided with Ethereum’s rally above $4,500 and Bitcoin’s push towards $120,000. Historically, such surges in search interest have preceded significant increases in trading volumes and price action across mid- and low-cap altcoins.

Yet this enthusiasm proved fleeting. By late August, Google Trends interest for “alt season” had dropped over 50% (source). The rapid ebb and flow of retail attention reflects how quickly FOMO can flip to fear or apathy - a dynamic that traders must factor into their strategies.

Bitcoin (BTC) Live Price & Trend

Powered by TradingView

BTC Dominance Shift: Altseason Confirmed?

The so-called "altseason" is typically marked by declining Bitcoin dominance as capital flows into alternative cryptocurrencies. According to Tangem, September 2025 saw exactly this scenario play out: Bitcoin’s share of total crypto market cap fell while altcoin trading volumes soared. Notably, institutional inflows into ETH also increased during this period - a signal that both retail and professional traders were positioning for higher risk-reward plays outside of BTC.

This shift is not just anecdotal; it’s visible in blockchain data and exchange order books. When Google search volumes for "altcoins" break records - as they did in August 2025 - it often precedes sharp moves in tokens that are otherwise overlooked during periods of BTC dominance.

Bitcoin Technical Analysis Chart

Analysis by Jessica Navarro | Symbol: BINANCE:BTCUSDT | Interval: 1W | Drawings: 8

Jessica Navarro is a long-term investor and portfolio manager with a focus on sustainable growth in both crypto and equity markets. With 14 years’ experience, she blends fundamental research with technical validation to build resilient portfolios. Jessica stands by: 'Invest for tomorrow, act with clarity today.'

fundamental-analysisportfolio-managementrisk-management
Bitcoin Technical Chart by Jessica Navarro

Jessica Navarro's Insights

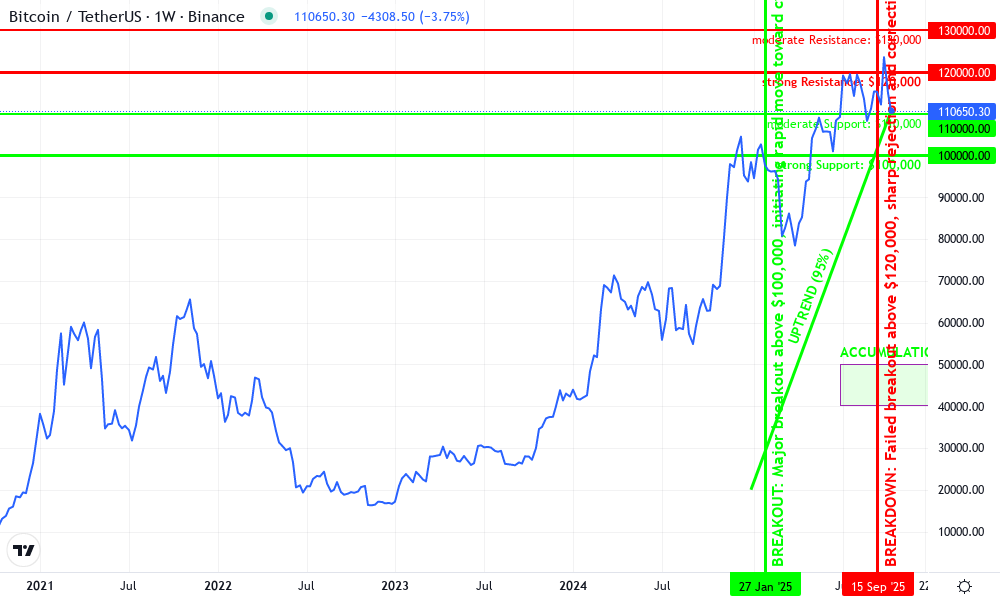
As a conservative, fundamentally-driven investor, I’m seeing clear evidence of late-cycle behavior in Bitcoin’s 2025 price action. The weekly chart shows a robust uptrend but also signals of exhaustion after pushing above $120,000 and failing to hold those highs. The price is consolidating around $110,600, which aligns with key psychological and technical support. Given the macro context—altseason FOMO peaking and now cooling rapidly—I am cautious about new entries at this level. I see the $100,000 area as critical for long-term support, and would only consider portfolio additions on deeper pullbacks or if we see renewed fundamental catalysts. Capital rotation into altcoins also increases downside risk for BTC short-term. My approach is to protect capital, avoid chasing, and wait for high-conviction, fundamentally-backed opportunities.

Technical Analysis Summary

Draw a primary uptrend line from the 2023 low (around $20,000) through the higher lows of 2024, just below $50,000, extending into 2025 above $100,000. Mark horizontal support at $110,000 and $100,000, and resistance at $120,000 and $130,000. Highlight the consolidation range between $110,000 and $120,000 from Q3 2025 to the current date. Use rectangles to indicate accumulation zones in late 2024 (below $50,000) and distribution near $120,000 in Q3-Q4 2025. Add vertical lines to mark major surges (early 2024, early 2025), and use text/callouts to annotate the recent volatility and ongoing altseason context. Use arrows to indicate potential retracement risk if support fails.

Risk Assessment: medium

Analysis: While long-term trend remains up, late-cycle volatility, distribution signs, and rotation into altcoins raise caution. Downside risk to $100,000 support is non-trivial. Upside potential exists but requires new catalysts.

Jessica Navarro's Recommendation: Avoid aggressive new entries. Consider adding to long-term holdings only on deeper retracements to $100,000 or below and with clear fundamental justification. Maintain stop-loss discipline. Monitor altcoin market dynamics closely.

Key Support & Resistance Levels

📈 Support Levels:
  • $110,000 - Immediate technical and psychological support coinciding with current consolidation zone. moderate
  • $100,000 - Major round number and previous breakout resistance, now key long-term support. strong
📉 Resistance Levels:
  • $120,000 - Recent cycle high and clear resistance after failed breakout attempts. strong
  • $130,000 - Potential next resistance if $120,000 is reclaimed with conviction. moderate

Trading Zones (low risk tolerance)

🎯 Entry Zones:
  • $100,000 - Long-term support and prior resistance. Entry here aligns with conservative, risk-managed positioning.low risk
🚪 Exit Zones:
  • $120,000 - Short-term profit target at overhead resistance if entering at $100,000.💰 profit target
  • $95,000 - Stop-loss just below major support to limit downside on failed support.🛡️ stop loss

Crypto Market Cycles Analysis: Retail Psychology at Work

The cyclical nature of crypto markets means that retail FOMO tends to cluster around key inflection points. In the 2024-2025 cycle, these clusters have become more extreme due to social media amplification and meme coin culture. As noted by MintonFin, memecoin activity acts as both a barometer and catalyst for wider altcoin rallies (source). When retail investors pile into trending tokens based on viral narratives or influencer tweets, liquidity floods the sector - but often just as quickly evaporates when sentiment turns.

This pattern underscores why so many traders watch Google Trends as closely as price charts. A spike in searches doesn’t guarantee sustained gains; instead it flags moments when herd behavior could create outsized volatility - both upward and downward.

Top 5 Altcoins Price Prediction Table (2026–2031): FOMO-Driven Scenario Analysis

Forecasting Altcoin Price Ranges Post-2025 Altseason, Considering Retail FOMO, Google Trends, and Market Cycles

2030<\/tdd$5,500<\/tdd$8,400<\/tdd$13,500<\/tdd$135\.00<\/tdd$220\.00<\/tdd$380\.00<\/tdd$45\.00<\/tdd$75\.00<\/tdd$130\.00<\/tdd$1\.40<\/tdd$2\.90<\/tdd$4\.70<\/tdd$1\.75<\/tdd$3\.30<\/tdd$6\.20<\/ttr2031<\/tdd$6,200<\/tdd$9,700<\/tdd$15,800<\/tdd$155\.00<\/tdd$260\.00<\/tdd$440\.00<\/tdd$52\.00<\/tdd$88\.00<\/tdd$150\.00<\/tdd$1\.60<\/tdd$3\.35<\/tdd$5\.50<\/tdd$2\.00<\/tdd$3\.90<\/tdd$7\.50<\/ttbody

For traders and investors, recognizing the signals embedded in retail FOMO is both an opportunity and a risk-management imperative. As we saw in August 2025, when Google Trends searches for "altcoin" soared, altcoins experienced dramatic price surges. However, the subsequent 50% drop in search interest by late August was a harbinger of sudden corrections across the sector. Such volatility is amplified by algorithmic trading and leveraged positions popular among retail traders, which can turn a wave of optimism into a rapid cascade of liquidations.

Key Psychological Triggers Behind Retail FOMO in Altcoin Rallies

  • crypto altcoin social media hype 2025
    Viral Social Media Hype: Platforms like X (formerly Twitter), Reddit, and TikTok amplify buzz around trending altcoins, fueling retail excitement and urgency to buy.
  • Ethereum price chart August 2025
    Record-Breaking Price Surges: Headlines about assets like Ethereum surpassing $4,500 and Bitcoin nearing $120,000 in August 2025 create a sense of missed opportunity, prompting fear of missing out on further gains.
  • Google Trends altcoin search 2025
    Google Trends Search Spikes: All-time high searches for terms like “altcoin” and “alt season” in August 2025 signal collective optimism and reinforce the belief that a major rally is underway.
  • crypto influencer altcoin endorsement 2025
    Influencer Endorsements: High-profile crypto influencers and YouTube personalities publicly backing specific altcoins drive retail investors to act quickly, fearing they’ll be left behind.
  • crypto millionaire success story 2025
    Success Stories and FOMO Narratives: Viral accounts of overnight millionaires and rapid portfolio growth during previous altseasons resurface, convincing new investors that similar gains are within reach.

Market participants who entered at peak enthusiasm often find themselves underwater as liquidity dries up and momentum shifts back toward Bitcoin or stablecoins. This cyclical pattern has repeated across past crypto market cycles but appears to be accelerating in 2025 due to faster information dissemination and heightened social media engagement.

Strategic Takeaways: Navigating Altcoin Rallies Amid FOMO

To thrive in this environment, traders must blend behavioral analysis with technical validation. Monitoring real-time data such as Google Trends for "altcoin" or "altseason" can provide an early warning system for shifts in sentiment. However, it’s essential to corroborate these signals with on-chain metrics, such as wallet activity, exchange inflows/outflows, and volume spikes, to distinguish between sustainable accumulation and speculative bubbles.

Heatmap visualizing Google Trends search interest and altcoin market cap changes during the 2025 crypto cycle, illustrating retail FOMO and altseason dynamics.

Another crucial consideration is position sizing during periods of peak FOMO. The temptation to chase parabolic gains is intense when everyone seems to be getting rich overnight. Yet historical data shows that disciplined allocation, limiting exposure during euphoric phases and scaling in during periods of apathy, produces superior long-term results.

Pro tip: Use search trend reversals as exit signals rather than entry points. When Google Trends interest falls sharply after a record high, it often precedes local tops in altcoin prices.

Looking Ahead: Will Retail FOMO Drive the Next Leg Up?

The interplay between retail enthusiasm and institutional positioning will define the remainder of the 2025 cycle. While Bitcoin currently trades at $110,670.00, its dominance remains under pressure as new narratives around decentralized AI tokens, real-world asset protocols, and cross-chain interoperability capture attention.

If history is any guide, another round of retail-driven rallies could emerge later this year, especially if macro conditions remain favorable and regulatory clarity improves. Still, seasoned investors know that true resilience comes from filtering out noise and focusing on projects with robust fundamentals rather than simply chasing trending tickers.

Retail FOMO & Altseason Timing: Your 2025 Crypto Trading FAQ

How does retail FOMO influence altcoin rallies in 2025?
Retail FOMO (Fear of Missing Out) plays a significant role in driving altcoin rallies, especially in 2025. When retail investors see rapid price increases and rising search interest—such as the Google Trends spike for "altcoin" in August 2025—they often rush to buy, pushing prices higher. This influx of new traders can lead to sharp, short-term rallies, but also increases volatility as sentiment can shift quickly, resulting in sudden corrections when interest wanes.
🚀
What signals indicate the start of an altseason?
Key signals for the start of an altseason include:
- Declining Bitcoin dominance (as seen in September 2025)
- Surging trading volumes in altcoins
- Record-high Google Trends searches for terms like "altcoin"
- Major news or technological advancements in the crypto space
When these factors align, it often marks the rotation of capital from Bitcoin (recently priced at $110,670.00) into altcoins, sparking broad-based rallies.
📈
How reliable are Google Trends and search interest as altseason indicators?
Google Trends data is a useful but imperfect tool for timing altseason. In August 2025, a record surge in searches for "altcoin" coincided with Ethereum breaking $4,500 and Bitcoin nearing $120,000. While such spikes often foreshadow retail-driven rallies, they can also signal peak enthusiasm—sometimes preceding a sharp drop in prices as seen with the 50% decline in "alt season" searches by late August. Use search interest as one of several indicators, not the sole basis for trading decisions.
🔍
What are the risks of trading altcoins during periods of high retail FOMO?
Trading altcoins during high retail FOMO can be extremely risky. Prices may rise rapidly, but they often become overextended, leading to sharp corrections when sentiment shifts. For example, after the August 2025 search spike, altcoin interest and prices retraced as enthusiasm faded. Always use risk management strategies such as stop-loss orders, and avoid overcommitting capital during euphoric market phases.
⚠️
How can traders strategically time their entry and exit during altseason?
Strategic timing in altseason requires a mix of technical analysis, sentiment tracking, and discipline. Monitor indicators like Bitcoin dominance, trading volumes, and search trends for "altcoin." Enter positions early in the rally when momentum is building, and set clear exit targets or trailing stops as FOMO peaks. Remember, as seen in 2025, retail sentiment can reverse quickly—so plan your exits before the crowd does.

Ultimately, understanding how Google Trends crypto trading data intersects with market cycles gives traders an edge, but only if paired with patience, research, and disciplined risk management. As always in crypto stock trading: invest for tomorrow but act with clarity today.

B
Written by

Blu

Author at Trading Crypto Stock

Comments

No comments yet. Be the first to share your thoughts!

YearEthereum (ETH) MinETH AvgETH MaxSolana (SOL) MinSOL AvgSOL MaxAvalanche (AVAX) MinAVAX AvgAVAX MaxPolygon (MATIC) MinMATIC AvgMATIC MaxArbitrum (ARB) MinARB AvgARB Max
2026$3,800$5,200$7,000$80.00$125.00$185.00$25.00$42.00$68.00$0.80$1.45$2.40$0.90$1.60$2.50
2027$4,100$5,800$8,500$95.00$145.00$225.00$28.00$48.00$80.00$0.95$1.75$2.90$1.10$1.95$3.30
2028$4,600$6,800$10,200$110.00$170.00$270.00$33.00$56.00$95.00$1.10$2.10$3.40$1.30$2.35$4.10
2029$5,000$7,600$11,800$120.00$190.00$320.00$38.00$64.00$110.00$1.25$2.50$4\.00<\/t$1\.50<\/t$2\.80<\/t$5\.10<\/t<\/tr