
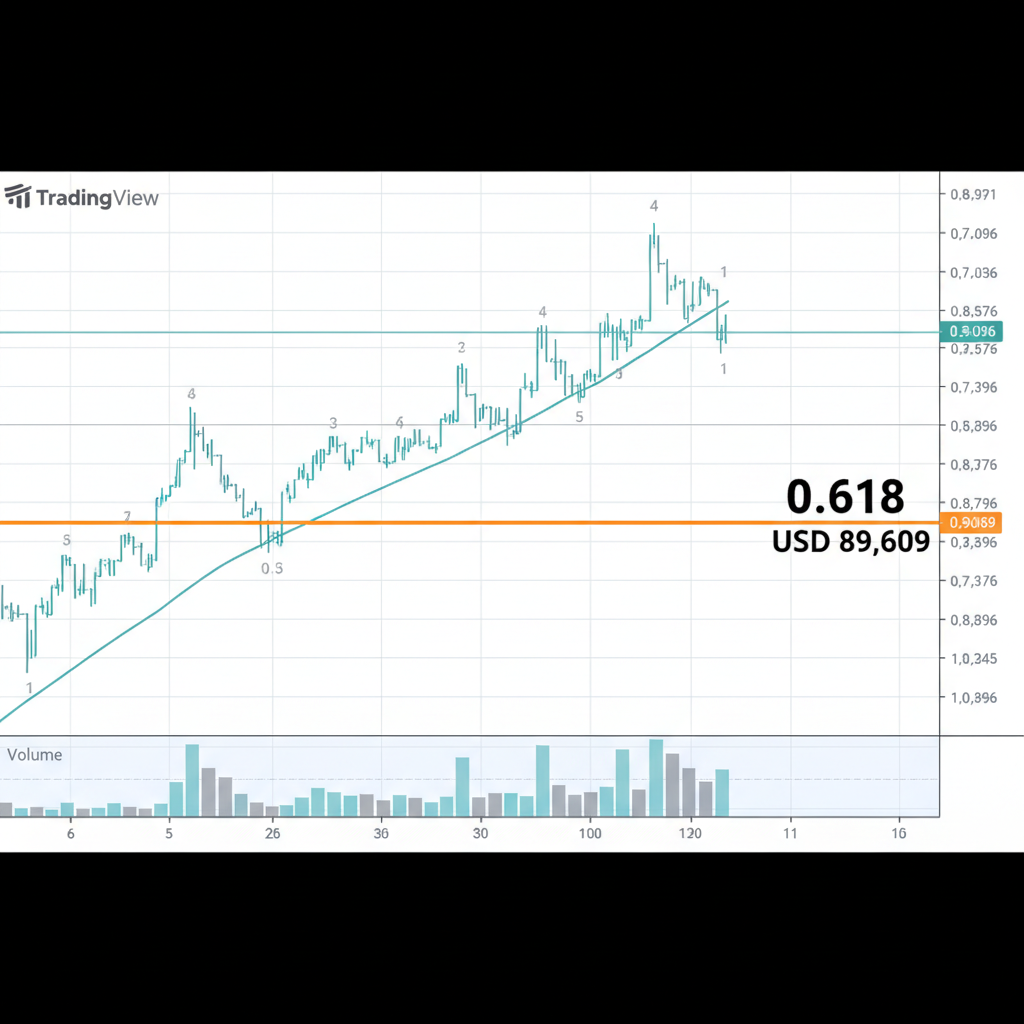
Hey traders, with Bitcoin hovering around $89,378.00 after a tiny dip of -0.008% in the last 24 hours, eyes are glued to those key support zones. And right now, the 0.618 Fibonacci retracement - that golden ratio sweet spot - is screaming opportunity for crypto stock traders like us. Forget chasing highs; this level turns corrections into low-risk entries, especially in BTC's wild swings.
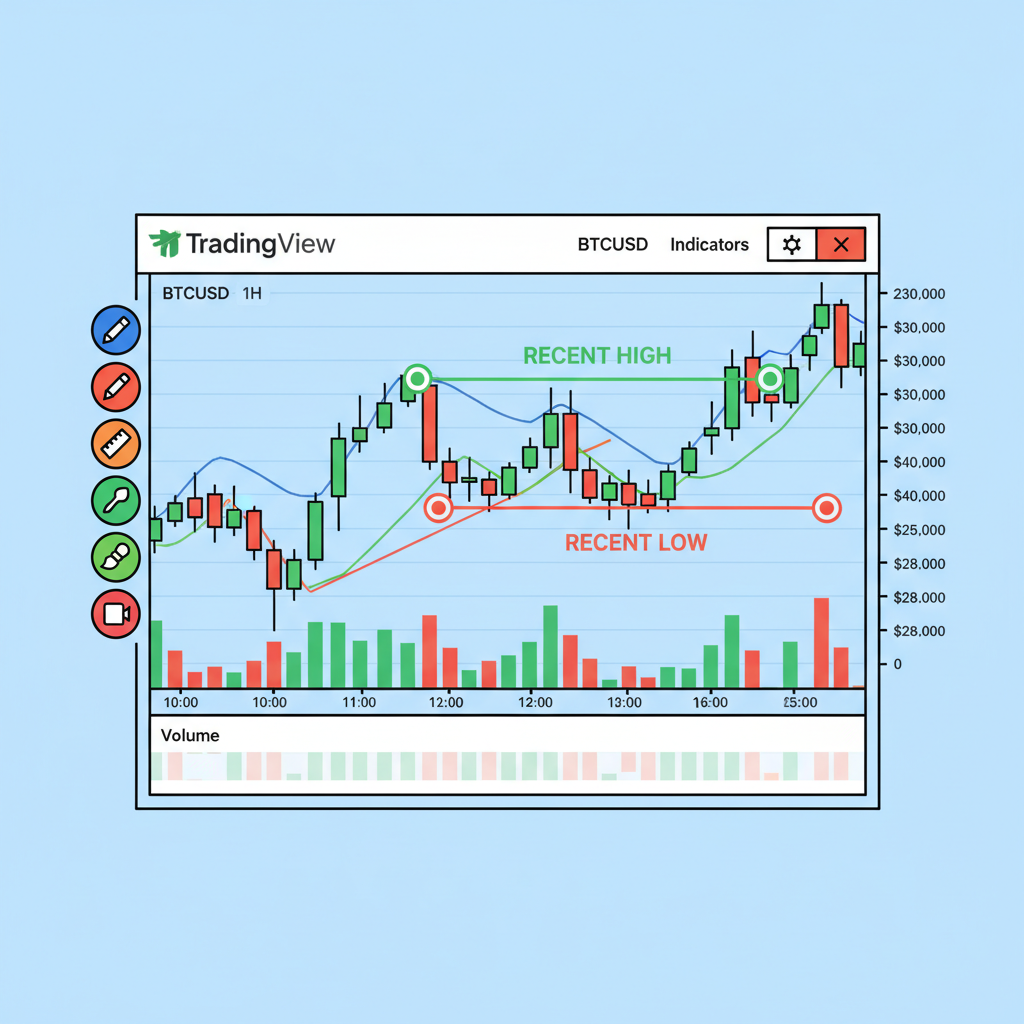
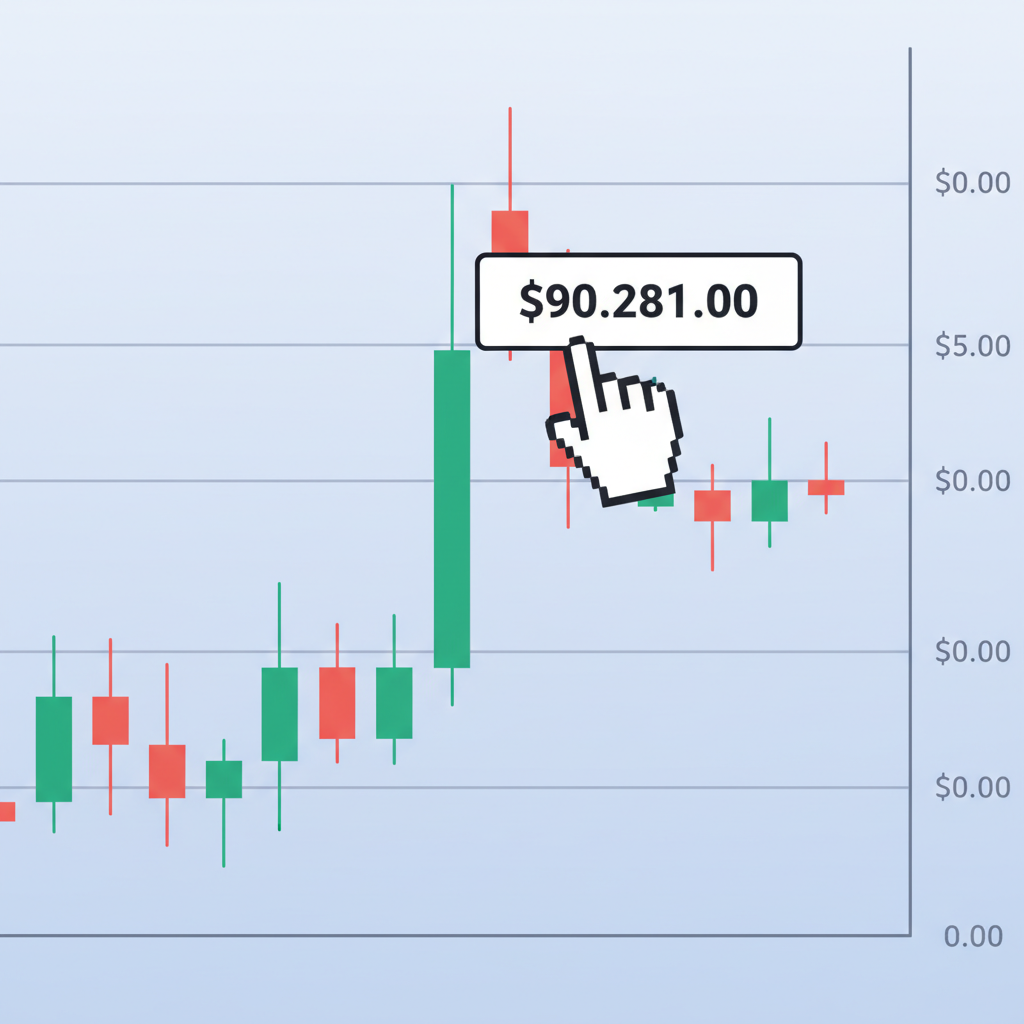
I've been riding these fib waves for years, and let me tell you, the 0.618 isn't just another line on your chart. Derived from the Fibonacci sequence, it's where price often pauses, bounces, or breaks with precision. Platforms like thinkorswim and TradingView make drawing these a breeze, highlighting support in uptrends or resistance in downtrends. In crypto's volatility, BTC respects this level like clockwork during pullbacks from recent highs like $90,281.
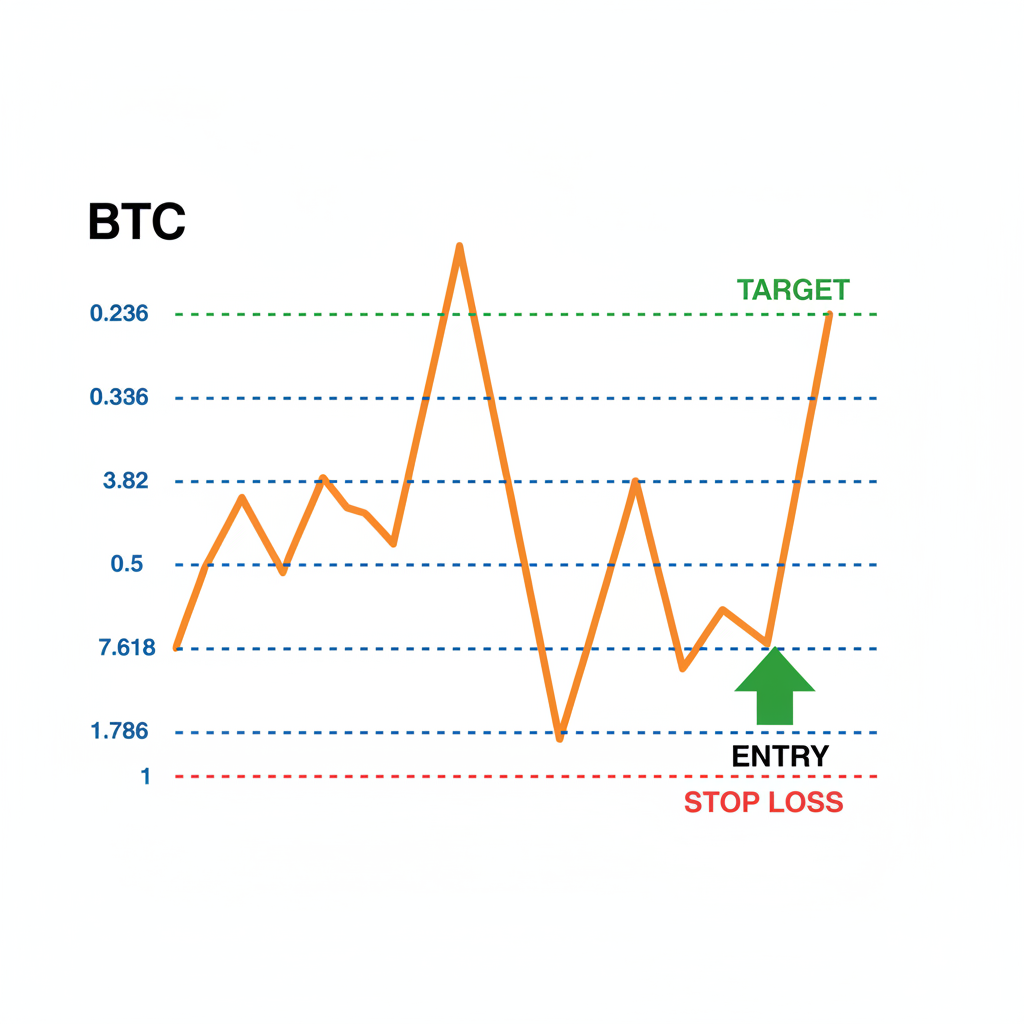
Mastering the Bullish Bounce at 0.618 Fib
Picture this: BTC surges, corrects, and taps the 0.618 retracement. That's your cue for the Bullish Bounce at 0.618 Fib: Enter Long on Doji/Hammer Confirmation with Stop 2% Below Level. Wait for that doji or hammer candle to form right at the level - it's the market saying, "Hey, buyers are stepping in!" I love placing my stop-loss 2% below to dodge fakeouts, keeping risk tight while eyeing extensions to 1.272 fib for profits. This setup has saved my bacon in countless BTC dips.
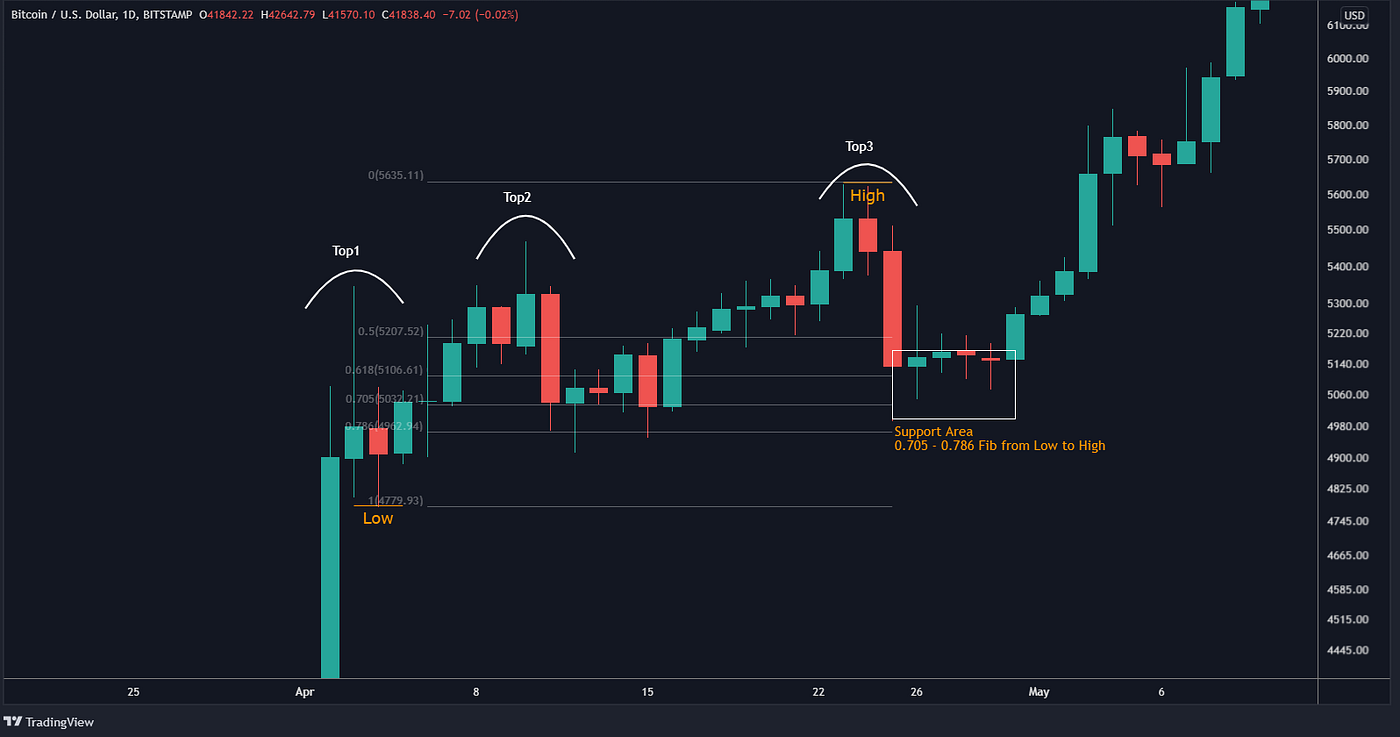
Bitcoin retracement patterns respect Fibonacci levels with precision during trends. The 61.8% level acts as a decisive battleground. - Stoic AI
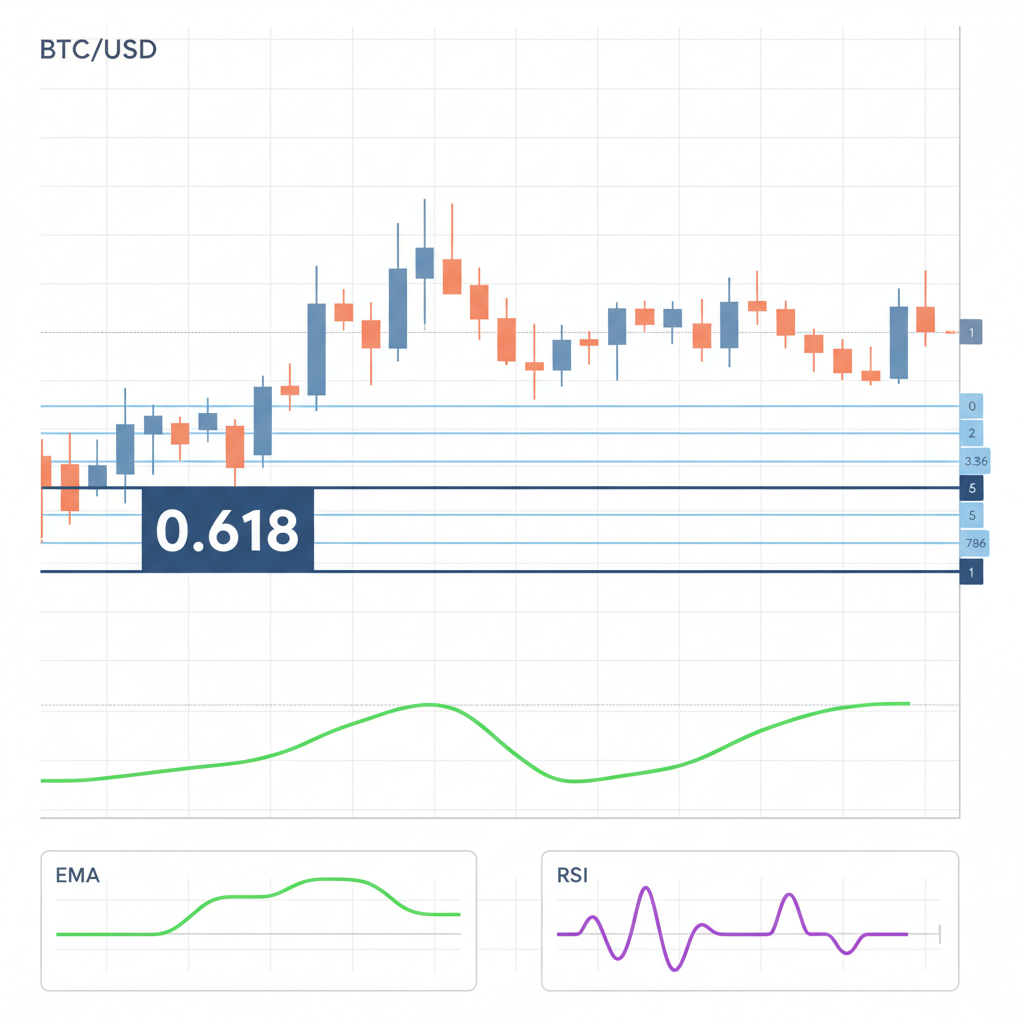
Confluence Long Setup: Layering Indicators for Bulletproof Entries
Why go solo when confluence cranks up the odds? The Confluence Long Setup: 0.618 Fib and 200-Day EMA Support and RSI >30 Oversold is my go-to for btc fibonacci trading strategies. Imagine BTC at $89,378 pulling back to 0.618, kissing the 200-day EMA, and RSI climbing above 30 from oversold territory. That's a triple-threat buy signal. No guessing games - just stack these, enter long, and let the trend resume. In crypto stock trading during corrections, this filters out noise like a pro.
Traders on Investopedia swear by fibs for spotting low-risk entries on pullbacks, and I've seen it play out in real-time on volatile assets like BTC. Combine with volume for extra conviction, and you're golden.
Navigating Bearish Breakdowns and Scaling Tactics
Not every 0.618 is a bounce party. Enter the Bearish Breakdown Short: Sell Below 0.618 Fib Retest with Volume Spike and Trailing Stop. If price retests from below and cracks it on heavy volume, short with a trailing stop to ride the downside. Perfect for those bitcoin price dip setups turning sour. Risk stays managed, rewards scale as momentum builds.
Then there's Scaling In on Hold: Add to Long Positions in 0.618-0.6188 Zone with 1% Risk Per Entry. Don't all-in at once; pyramid into strength as price holds the zone. Each add risks just 1%, building conviction without overexposure. This shines in prolonged consolidations around $89,378, turning patience into profits.
Bitcoin (BTC) Price Prediction 2027-2032
Long-term forecasts incorporating 0.618 Fibonacci retracement strategies from 2026 baseline of $89,378, focusing on support bounces and trend continuations
| Year | Minimum Price | Average Price | Maximum Price | YoY % Change (Avg) | Market Scenario |
|---|---|---|---|---|---|
| 2027 | $72,000 | $115,000 | $165,000 | +29% | Recovery bounce at 0.618 fib support post-correction |
| 2028 | $105,000 | $170,000 | $260,000 | +48% | Halving cycle rally with fib confluence |
| 2029 | $150,000 | $260,000 | $450,000 | +53% | Bull peak targeting fib extensions |
| 2030 | $190,000 | $380,000 | $650,000 | +46% | Consolidation with 0.618 retests |
| 2031 | $280,000 | $520,000 | $900,000 | +37% | Adoption-driven surge, fib golden pocket |
| 2032 | $380,000 | $720,000 | $1,200,000 | +38% | Mature growth, strong fib structure |
Price Prediction Summary
Bitcoin's price is projected to grow significantly from the 2026 level of $89,378, with average prices reaching $720,000 by 2032. Min/max ranges capture bearish retracements to 0.618 fib levels and bullish breakouts, aligned with cycles, halvings, and adoption.
Key Factors Affecting Bitcoin Price
- Bitcoin halving in 2028 boosting scarcity
- Institutional adoption and ETF inflows
- Global regulatory clarity
- Scalability improvements (e.g., Layer 2)
- Macro trends as inflation hedge
- 0.618 Fibonacci retracements as key support zones
- Historical 4-year market cycles
- Competition and market dominance
Disclaimer: Cryptocurrency price predictions are speculative and based on current market analysis. Actual prices may vary significantly due to market volatility, regulatory changes, and other factors. Always do your own research before making investment decisions.
For the multi-timeframe hunters, the Multi-Timeframe Fib Trade: Confirm 0.618 Daily Align with 4H 0.618 for High R: R Longs delivers killer risk-reward. Daily 0.618 lining up with 4H? That's high-probability gold. Zoom out, confirm alignment, enter on 4H bounce, and target those juicy extensions. In crypto's chaos, this keeps you ahead of the herd.
Right now, with Bitcoin at $89,378.00 after dipping from a 24-hour high of $90,281.00, that daily 0.618 fib is lurking nearby, aligning roughly with the 4H pullback zone from today's action. High risk-reward longs here could target a push back to $90k and, but only if lower timeframes confirm the bounce. This multi-timeframe stack turns guesswork into geometry-backed conviction, perfect for fib level entry points btc.
Applying These Strategies in Today's Volatile Dip
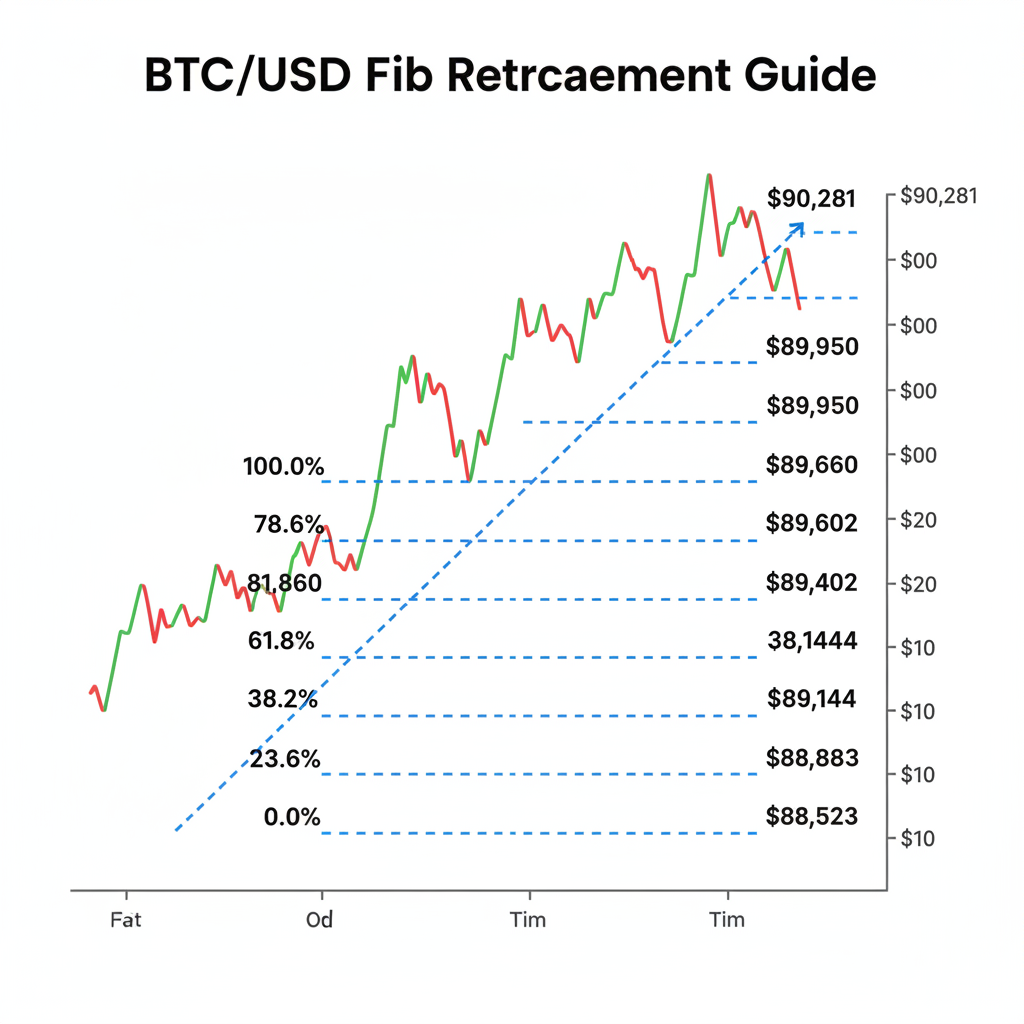
Zoom into the current setup: BTC's sitting at $89,378.00, smack in a potential 0.618 retracement from the recent swing. For the bullish bounce, scan for doji or hammer action; I've seen these ignite 5-10% rallies from similar spots. Layer in confluence with the 200-day EMA - if it holds, RSI ticking above 30 seals the deal for longs. Bearish folks, watch for volume spikes cracking that retest; shorts could chase to $88,523 lows with trailing stops.
Unlock BTC's 0.618 Fib Magic: Draw It on TradingView for the $90K Pullback!
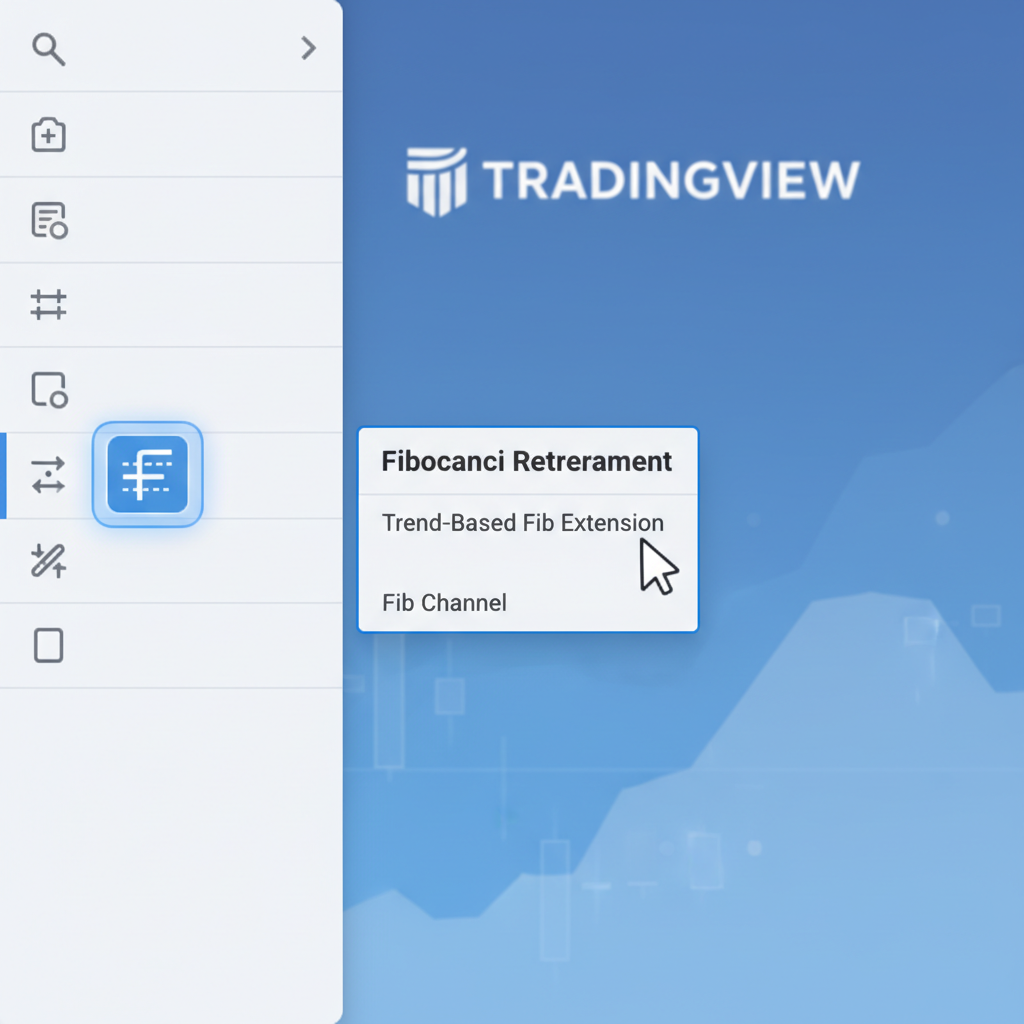
Scaling in the 0.618-0.6188 zone keeps you nimble around $89,378.00. Add 25% position size per confirmation candle, capping at 1% risk each - it's how I build winners without sweating drawdowns. Multi-timeframe alignment? Check daily for the big picture, 4H for precision entry. TradingView pros highlight how these levels nail crypto pullbacks, echoing Investopedia's low-risk entry wisdom.
Charles Schwab's thinkorswim users rave about fib tools spotting support in stocks, and it translates seamlessly to BTC. Hantec Markets notes fibs shine in volatile cryptos like Ethereum too, but Bitcoin's the king for precision. BingX's golden pocket (0.618-0.65) matches our scaling zone, where momentum stalls and reverses sharp.
Risk Management: The Real Edge in Fib Trading
Volatility's crypto's middle name, so never trade fibs blind. For every long at 0.618, my stop hugs 2% below or the 0.786 level - that's non-negotiable. Position size to 1-2% account risk max, trail stops on winners using 1.272 extensions. In bear breakdowns, volume spikes confirm the short; without 'em, sit tight. This isn't gambling; it's stacking probabilities in crypto stock trading during corrections.
Market Rebellion calls fibs a no-nonsense powerhouse for price behavior insights, and CMC Markets lists 0.618 as a core level alongside 0.5 and 0.786. Stoic AI dubs it BTC's battleground - spot on. Refine these five setups daily: bullish bounce for quick scalps, confluence for swings, breakdowns for counter-trend zings, scaling for patience plays, multi-timeframe for the big leagues.
Stick to the plan, ride the volatility, manage the risk. With BTC eyeing $89,378.00 as a pivot, these bitcoin 0.618 fib retracement plays could fuel your next green week. Chart it, confirm it, trade it smart.

No comments yet. Be the first to share your thoughts!