

Crypto markets in 2025 are living up to their reputation for volatility. With Bitcoin (BTC) trading at $88,011 and Ethereum (ETH) at $2,922.31 as of November 25, traders are facing wild price swings and rapid sentiment shifts. Successfully navigating this environment demands more than luck or guesswork, it requires a toolkit of robust, adaptable strategies that can weather the storm and capitalize on opportunity.
This guide breaks down the five most effective crypto trading strategies for volatile markets in 2025. Each approach is tailored to today’s conditions, with a focus on risk management, optimal trade timing, and safeguarding your capital through uncertainty.
Dynamic Position Sizing with Volatility Adjustments
One of the most overlooked aspects of trading is position sizing, how much of your portfolio you allocate to a single trade. In highly volatile periods like we’re seeing now, static positions can expose you to unnecessary risk. Instead, dynamic position sizing uses real-time volatility data to adjust your exposure.
For example, when Bitcoin surges above $88,000, price swings can expand rapidly. By reducing your position size when volatility spikes (measured by indicators like Average True Range or Bollinger Bands width), you limit downside risk while staying in the game during calmer periods. This adaptive approach helps protect profits and prevent devastating losses during sudden market reversals.
Utilizing Moving Average Crossovers for Timely Entries and Exits
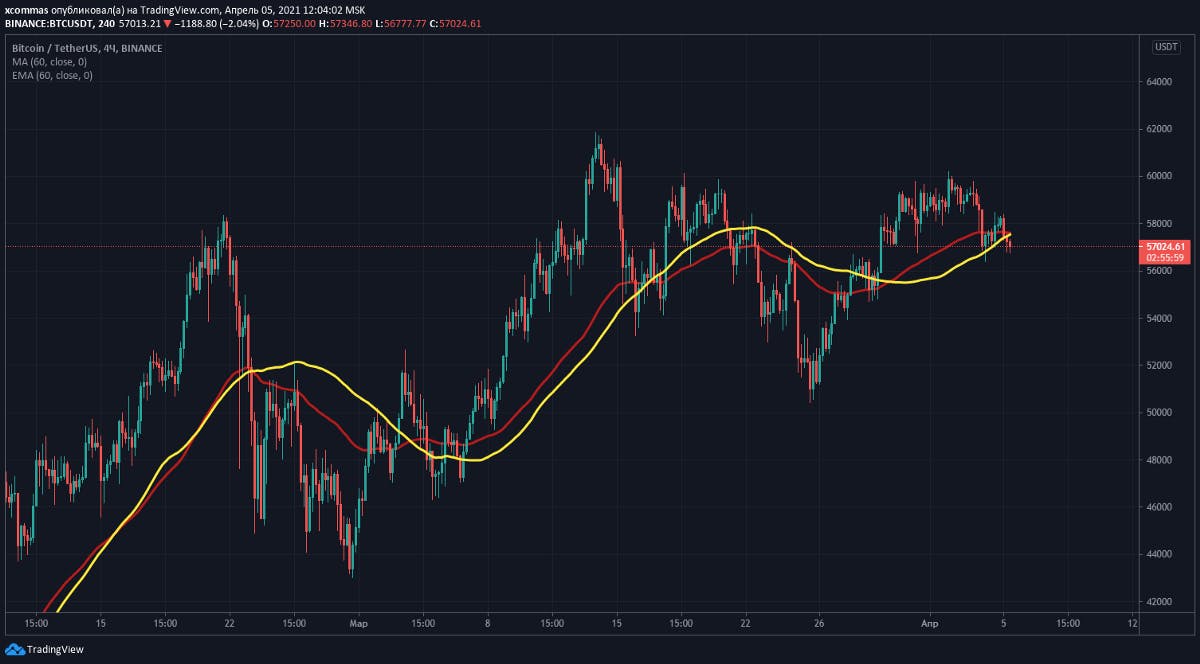
The classic moving average crossover remains a staple among crypto trading strategies in 2025. By plotting two moving averages, typically one short-term (such as the 9-day EMA) and one long-term (like the 50-day EMA): traders watch for crossover points that signal momentum shifts.
A bullish crossover (short-term moving average crossing above long-term) can indicate an opportune entry point during an uptrend. Conversely, a bearish crossover suggests it may be time to exit or reduce exposure. In today’s fast-moving environment where Bitcoin can move several thousand dollars in hours, these signals help traders catch big moves early while avoiding false breakouts.
Bitcoin Technical Analysis Chart
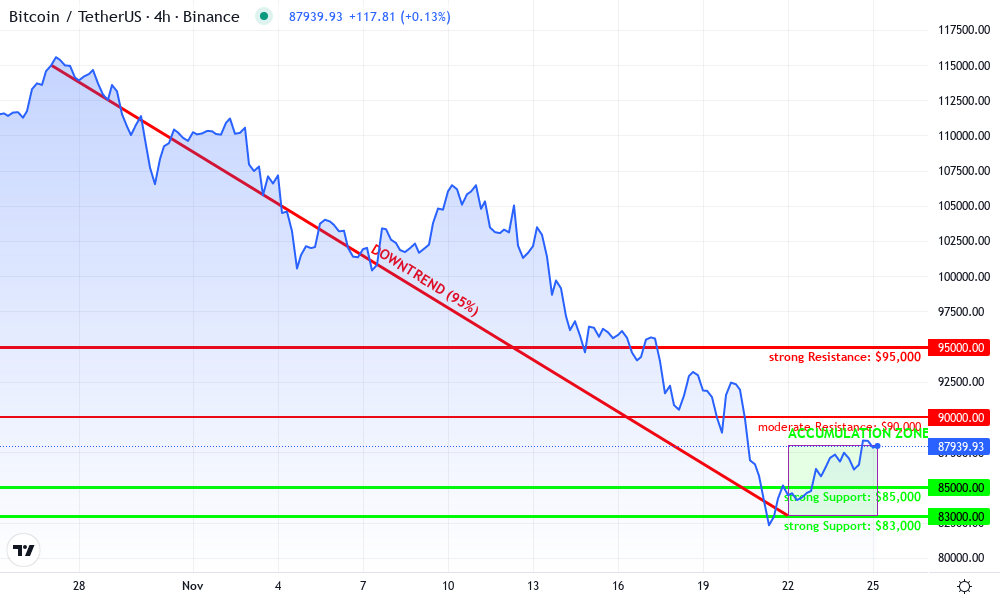
Analysis by Samantha Leighton | Symbol: BINANCE:BTCUSDT | Interval: 1D | Drawings: 6
Technical Analysis Summary
Let's break down the current Bitcoin (BTC/USDT) 4-hour chart, focusing on the clear downtrend throughout November 2025, followed by a recent short-term bounce. Draw a primary downtrend line from the late October highs (~$115,000) to the recent lows (~$83,000) for visual clarity. Add horizontal lines at key support ($85,500, $83,000) and resistance levels ($90,000, $95,000, $100,000). Mark the recent accumulation range from Nov 22-25 between $83,000 and $88,000 with a rectangle. Use arrow markers to highlight the bullish reaction off the $83,000 level. For MACD and volume, place callouts below price showing where a potential bullish divergence or volume spike may have occurred during the latest bounce. Emphasize risk-managed entries only above reclaimed resistance levels, and stop-loss placement below recent local lows.
Risk Assessment: medium
Analysis: While the bounce from $83,000 is encouraging, the dominant trend remains bearish and overhead resistance is significant. Volatility is high, and confirmation above $90,000 is needed for a lower-risk bullish bias.
Samantha Leighton's Recommendation: For new investors, I recommend waiting for a clear reclaim and hold above $90,000 before considering fresh long entries. If already positioned, maintain a stop just below $83,000. Always size positions moderately and avoid overcommitting in this volatile phase.
Key Support & Resistance Levels
📈 Support Levels:
- $85,000 - Recent local support; price bounced aggressively near here strong
- $83,000 - Monthly low and key psychological level strong
📉 Resistance Levels:
- $90,000 - First significant resistance overhead; previous support, now resistance moderate
- $95,000 - Major breakdown level; aligns with prior consolidation strong
- $100,000 - Major psychological barrier, previous support turned resistance strong
Trading Zones (medium risk tolerance)
🎯 Entry Zones:
- $88,500 - Aggressive entry on confirmation of higher low above $85,000; requires tight risk management medium risk
- $90,500 - Safer entry after confirmed break and hold above $90,000 resistance low risk
🚪 Exit Zones:
- $83,000 - Stop-loss in case of breakdown below strong support 🛡️ stop loss
- $95,000 - Profit target at next major resistance after breakout 💰 profit target
- $100,000 - Extended profit target at psychological barrier 💰 profit target
Technical Indicators Analysis
📊 Volume Analysis:
Pattern: Look for spike in volume on the bounce from $83,000 to $88,000 range
Increased volume supports the theory of accumulation and potential reversal zone
📈 MACD Analysis:
Signal: Potential bullish divergence forming as price makes new lows but momentum improves
Watch for MACD crossover confirmation to validate the bounce and signal possible reversal
Applied TradingView Drawing Utilities
This chart analysis utilizes the following professional drawing tools:
Disclaimer: This technical analysis by Samantha Leighton is for educational purposes only and should not be considered as financial advice. Trading involves risk, and you should always do your own research before making investment decisions. Past performance does not guarantee future results. The analysis reflects the author's personal methodology and risk tolerance (medium).
Incorporating Relative Strength Index (RSI) for Overbought/Oversold Signals
The Relative Strength Index (RSI) is another essential tool for timing trades in volatile markets. RSI measures recent price changes to identify overbought or oversold conditions, typically using thresholds of 70 (overbought) and 30 (oversold).
If Bitcoin’s RSI spikes above 70 while trading near $88,011, it may signal that price has run too far too fast, suggesting a potential pullback or reversal is near. Conversely, an RSI below 30 could indicate selling exhaustion and present a buying opportunity during sharp corrections.
Combining RSI with other strategies like moving average crossovers increases reliability by filtering out noise from false signals, a critical edge when prices are swinging wildly day-to-day.
Bitcoin (BTC) Price Prediction Table: 2026-2031
Based on Technical Analysis, RSI, Market Trends, and Advanced Trading Strategies for Volatile Markets in 2025
| Year | Minimum Price | Average Price | Maximum Price | % Change (Avg YoY) | Market Scenario Insights |
|---|---|---|---|---|---|
| 2026 | $72,500 | $93,000 | $120,000 | +5.7% | Consolidation after 2025 highs; regulatory clarity and ETF inflows support price, but volatility remains high. |
| 2027 | $80,000 | $105,000 | $140,000 | +12.9% | Adoption by institutional investors accelerates; Layer-2 scaling and payment integrations drive demand. |
| 2028 | $88,000 | $117,000 | $160,000 | +11.4% | Potential halving effect boosts scarcity narrative; global macro shifts increase BTC’s store-of-value appeal. |
| 2029 | $95,000 | $133,000 | $185,000 | +13.7% | Bullish cycle peak possible; competition from CBDCs and regulatory headwinds create wide price range. |
| 2030 | $85,000 | $122,000 | $170,000 | -8.3% | Post-peak correction and consolidation; market matures, volatility decreases, and long-term holders dominate. |
| 2031 | $90,000 | $139,000 | $200,000 | +13.9% | Renewed adoption, new use cases (e.g., DeFi, tokenization); technological improvements and global acceptance expand market cap. |
Price Prediction Summary
Bitcoin is projected to experience continued volatility with an overall upward trend through 2031. Strategic adoption of advanced trading strategies, AI-assisted analysis, and risk management tools will be crucial for navigating market swings. The halving cycle, regulatory environment, and institutional adoption are expected to play a major role in driving price action. Average prices are forecasted to grow steadily, but significant fluctuations between minimum and maximum yearly prices reflect both bullish and bearish possibilities.
Key Factors Affecting Bitcoin Price
- Institutional and retail adoption rates, especially due to ETFs and payment networks integration.
- Regulatory developments globally, including US, EU, and Asia.
- Technological advancements such as Layer-2 solutions, AI-driven trading, and quantum-resistant security.
- Bitcoin halving cycles impacting supply and scarcity narrative.
- Macro-economic factors like inflation, monetary policy, and global capital flows.
- Competition from Ethereum, altcoins, and emerging CBDCs.
- Market psychology, sentiment trends, and the impact of AI-powered trading bots.
- On-chain data analysis (exchange flows, whale activity, miner behavior).
Disclaimer: Cryptocurrency price predictions are speculative and based on current market analysis. Actual prices may vary significantly due to market volatility, regulatory changes, and other factors. Always do your own research before making investment decisions.
Why These Strategies Matter Now
The current climate isn’t just about chasing gains; it’s about survival and smart adaptation. As institutional capital flows into crypto stocks and retail traders react to every headline, volatility will remain elevated throughout 2025. Mastering these tools gives you structure, a way to make decisions based on data rather than emotion.
If you want to dive deeper into trend following or advanced entry/exit tactics, check out our detailed guide on trend-following strategies for profitable crypto stock trading.
Implementing Dollar-Cost Averaging (DCA) During Market Swings
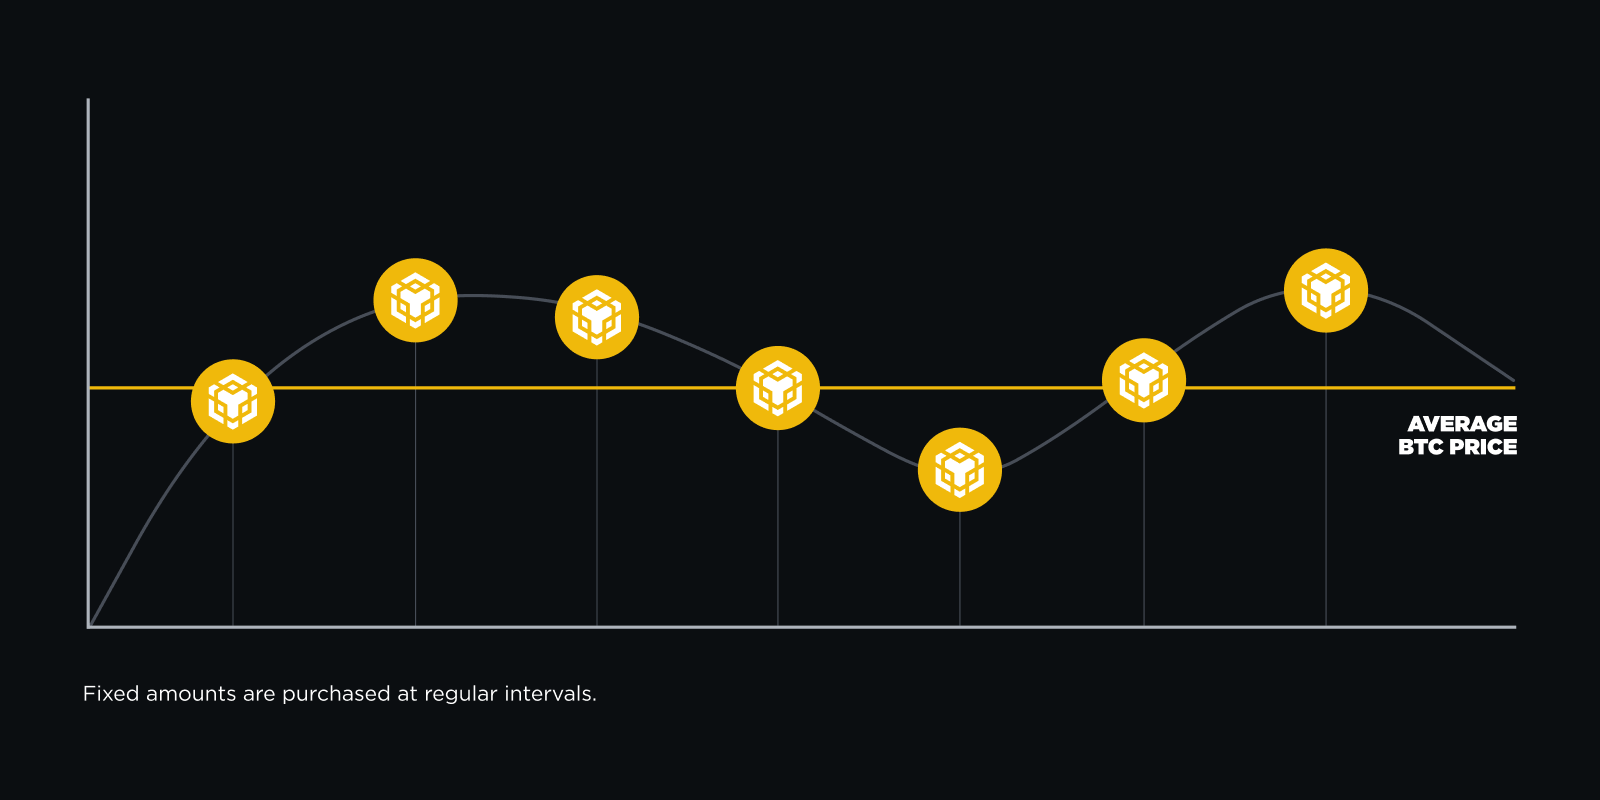
Even in a market as turbulent as 2025’s, where Bitcoin hovers at $88,011 and Ethereum at $2,922.31, you don’t need to time every top and bottom to win. Dollar-Cost Averaging (DCA) remains a powerful approach for both new and experienced traders. By investing a fixed amount at regular intervals, regardless of price, you smooth out entry points and reduce the risk of going all-in during a short-lived peak or panic-driven dip.
Modern DCA strategies are more sophisticated than ever. Platforms now allow you to automate buys based on specific triggers, such as RSI levels or moving average crossovers. For instance, you might set conditional rules: only buy when RSI dips below 35 or after a bearish crossover resolves. This hybrid approach combines the discipline of DCA with tactical market awareness, helping you accumulate assets during periods of weakness while avoiding overexposure in overheated rallies.
Advanced Risk Management with Stop-Loss and Take-Profit Automation
No matter how well-researched your crypto trading strategies are, managing risk is non-negotiable, especially when volatility is the norm. Automated stop-loss and take-profit orders form the backbone of modern risk management in crypto markets.
A stop-loss order automatically exits your position if the price moves against you beyond a set threshold (for example, if BTC drops below $85,416). Conversely, a take-profit order locks in gains by selling when your target price is reached (such as BTC surpassing $89,191). These tools help eliminate emotional decision-making and keep losses manageable, even if you’re away from your screen during sharp overnight moves.
The best traders in 2025 combine these automated orders with dynamic position sizing, so that as volatility increases, both their exposure and their stop distances adjust accordingly. This synergy keeps portfolios resilient through sudden drawdowns while still capturing upside potential.
Putting It All Together: A Disciplined Framework for Volatile Markets
The five strategies outlined provides Dynamic Position Sizing with Volatility Adjustments, Utilizing Moving Average Crossovers for Timely Entries and Exits, Incorporating RSI for Overbought/Oversold Signals, Implementing DCA During Market Swings, and Advanced Risk Management with Stop-Loss and Take-Profit Automation: form a robust framework for navigating today’s rollercoaster crypto environment.
Top 5 Crypto Trading Strategies for 2025
- Utilizing Moving Average Crossovers for Timely Entries and ExitsUse strategies like the Golden Cross (50-day moving average crossing above the 200-day) or Death Cross for spotting trend reversals. Charting platforms such as TradingView provide customizable moving average overlays to identify these signals.
- Incorporating Relative Strength Index (RSI) for Overbought/Oversold SignalsThe RSI helps pinpoint when assets like Bitcoin ($88,011) or Ethereum ($2,922.31) are overbought or oversold. Platforms like CoinMarketCap and Glassnode offer real-time RSI data for major cryptocurrencies.


The key is not to rely on any single tactic but to combine them into an adaptive system that responds to shifting market conditions. With Bitcoin at $88,011, every percentage point counts; protecting capital is just as important as chasing returns. By approaching each trade with discipline, and leveraging automation where possible, you’ll be better positioned to thrive no matter what wild swings lie ahead.
If you’re curious about building out a complete trading plan or want actionable steps for creating your own system from scratch, explore our comprehensive playbook on how to build a profitable crypto trading system in 2025.




No comments yet. Be the first to share your thoughts!