
Spotting reliable trading setups in the volatile world of crypto stocks can feel like searching for a needle in a haystack. But among all the crypto trading patterns, few are as visually distinct or potentially powerful as the cup and handle pattern. This classic bullish continuation setup - originally made famous in traditional stock markets - has found new life on the digital charts of Bitcoin, Ethereum, and countless altcoins. If you've ever wondered how savvy traders catch those breakout rallies just before they run, understanding this pattern is a must.
What Is the Cup and Handle Pattern in Crypto?
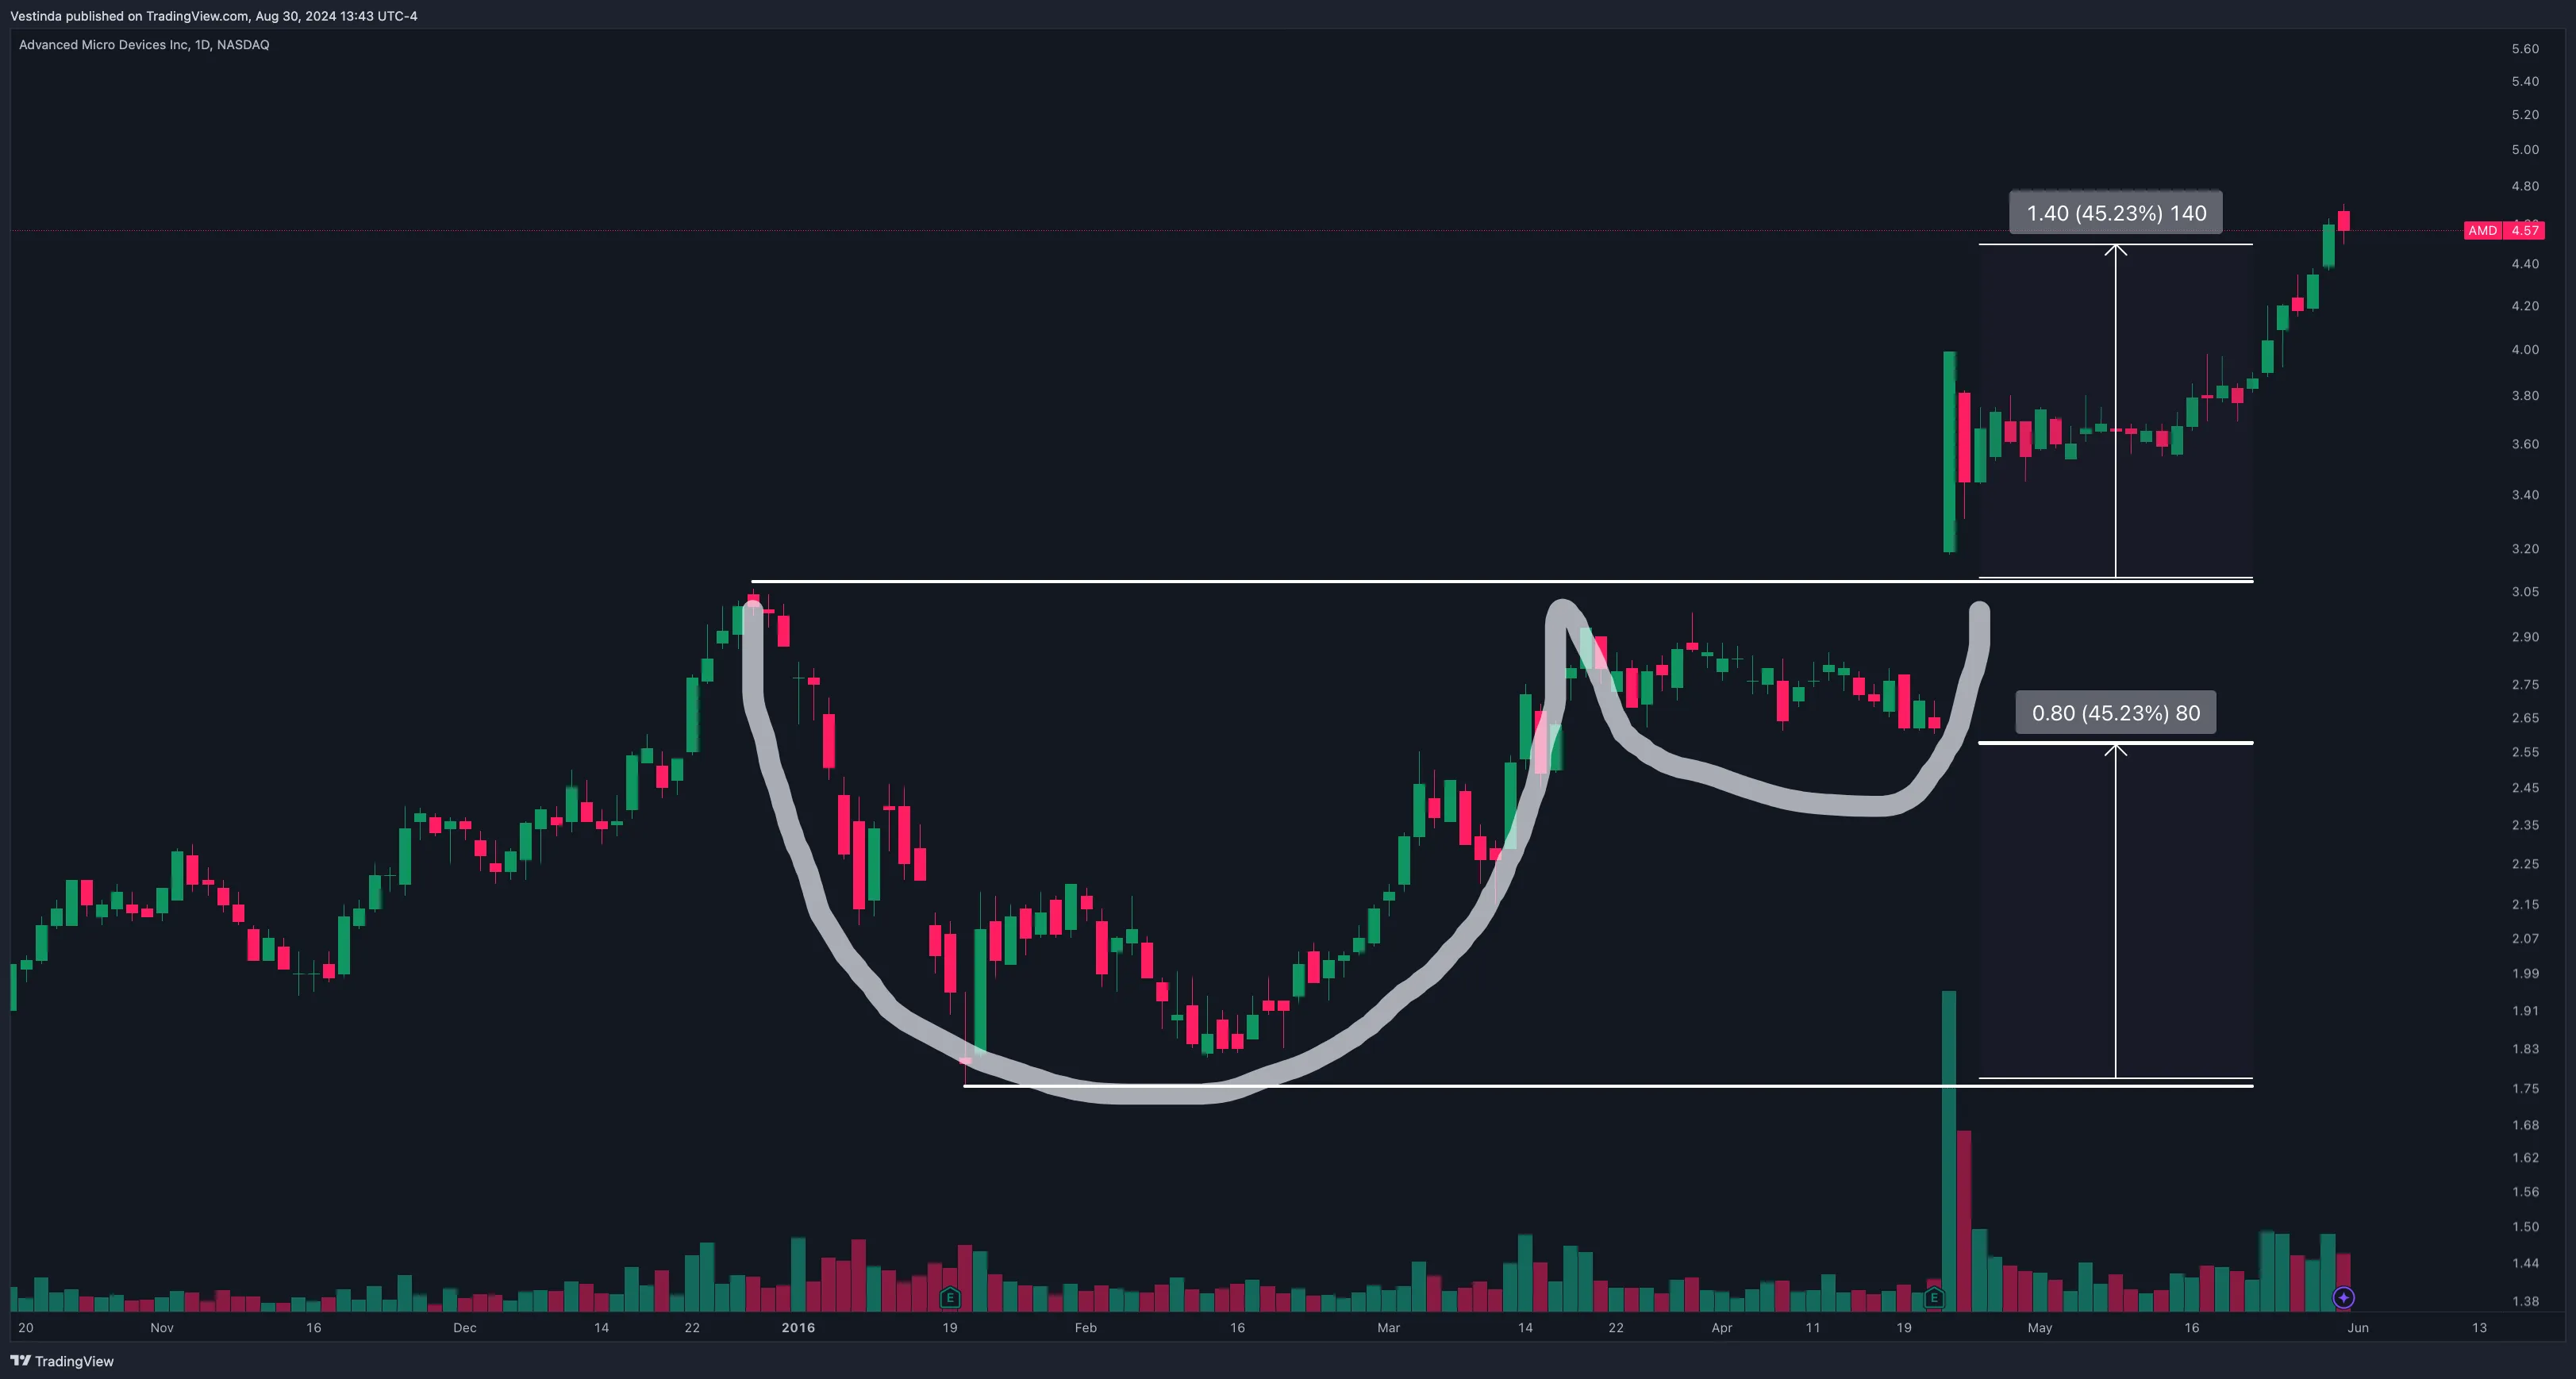
The cup and handle pattern is a bullish continuation formation that signals potential upward movement after a period of consolidation. It consists of two main parts:
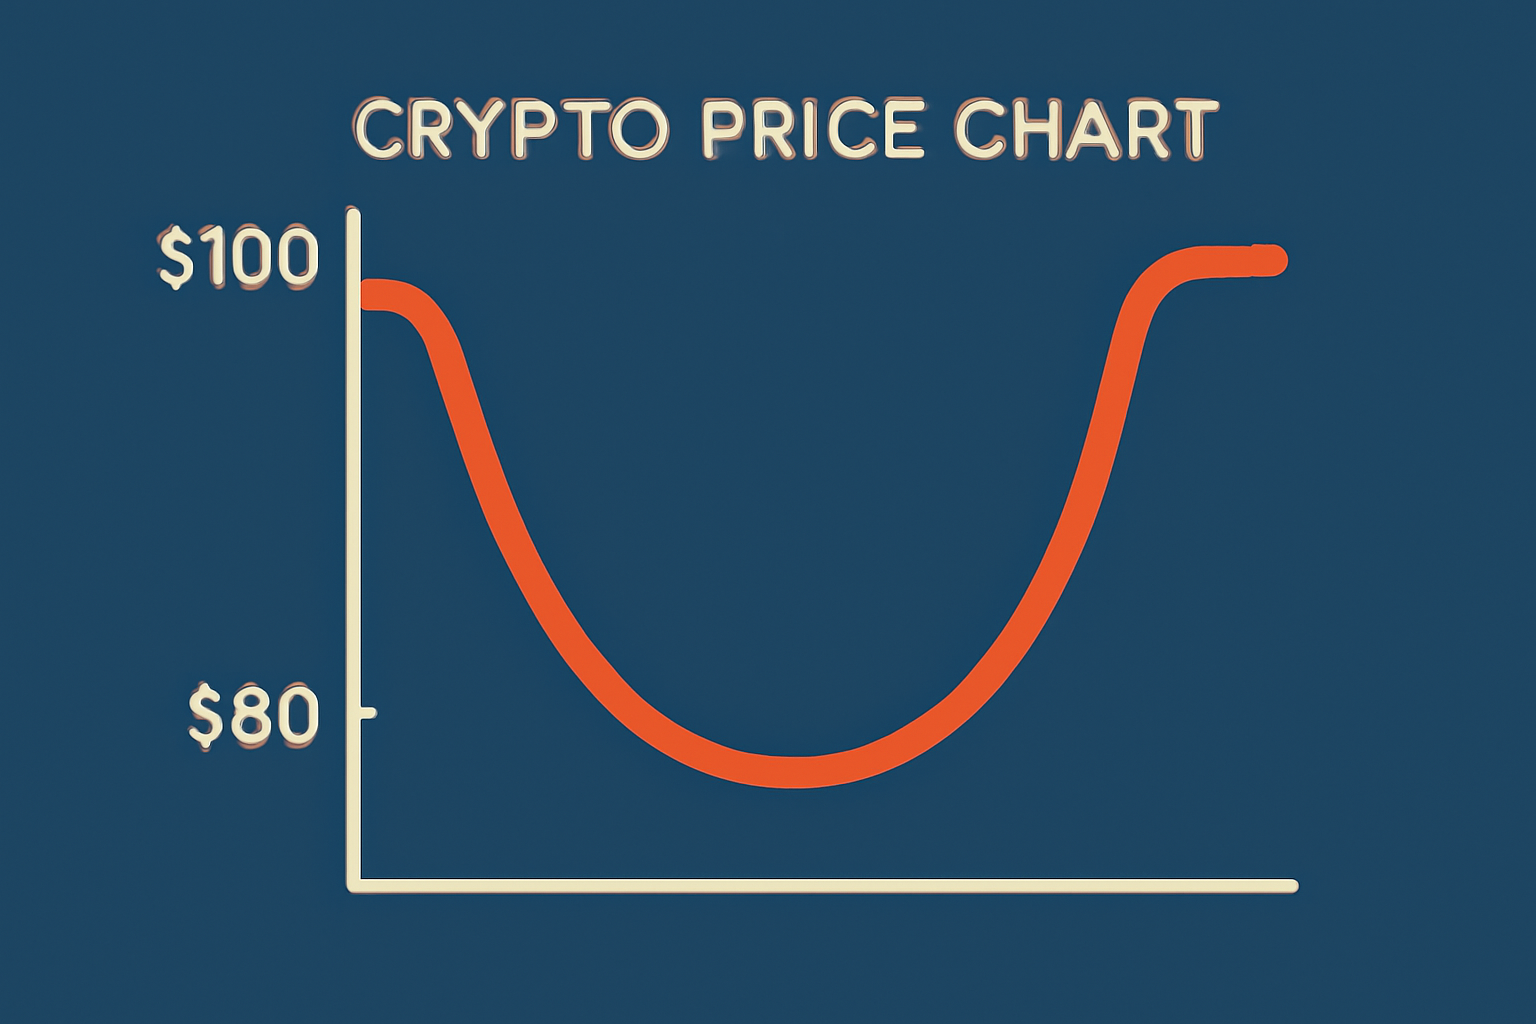
- Cup: A rounded bottom forms after a decline, creating a 'U' shape.
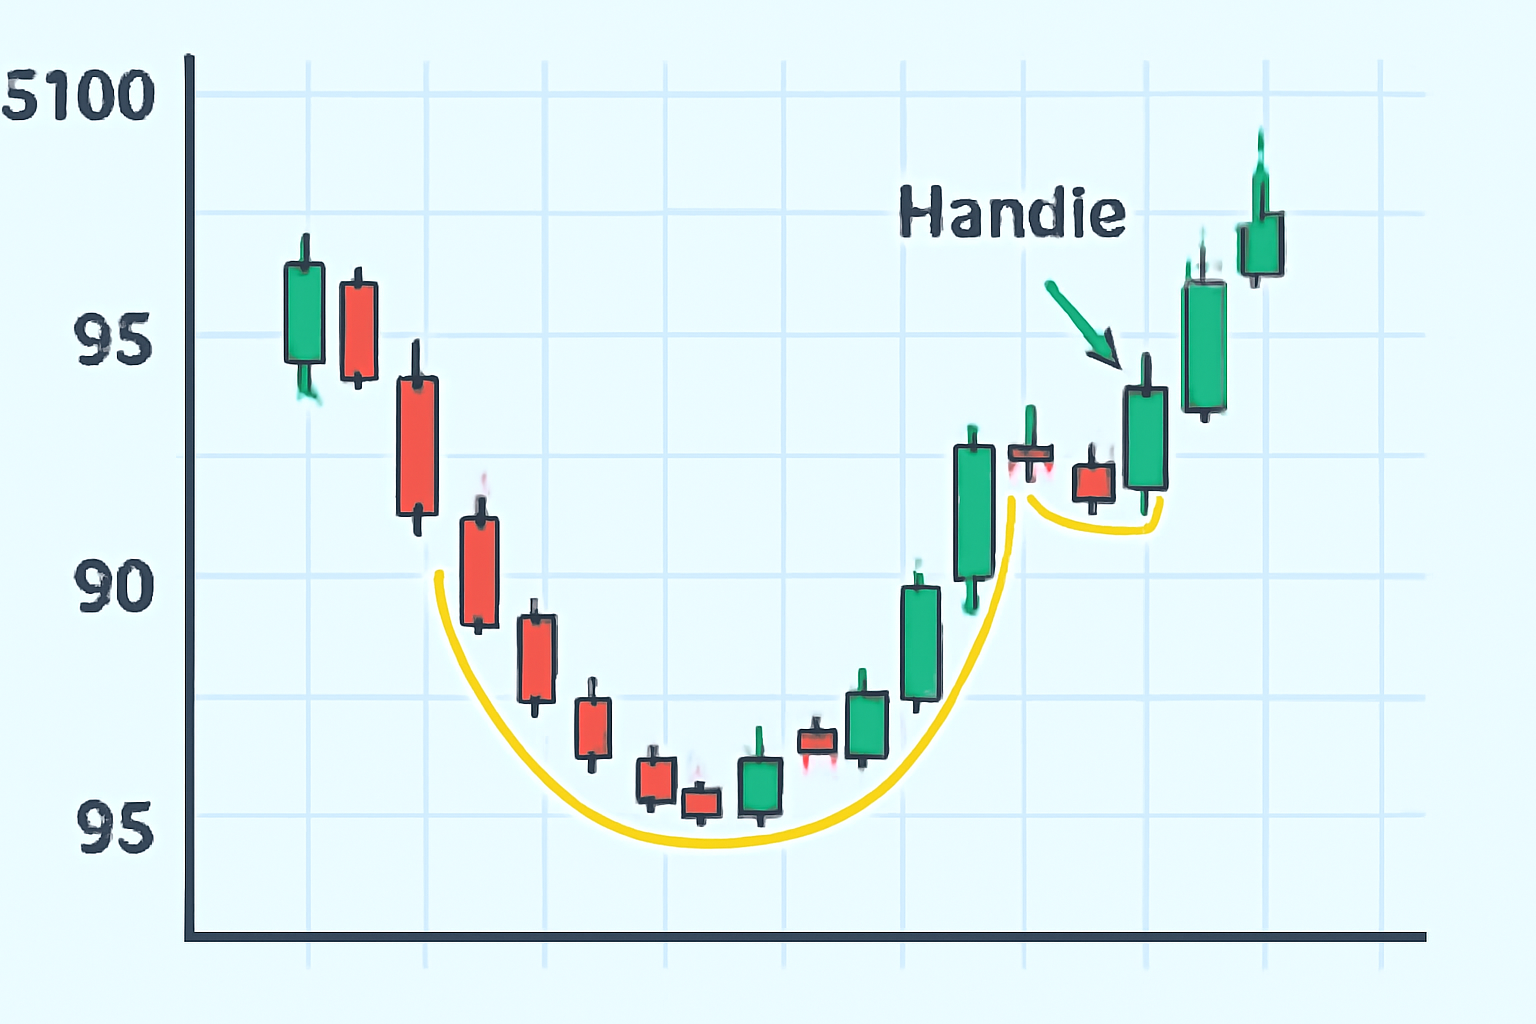
- Handle: A smaller, downward-sloping consolidation that follows the cup.
This structure suggests that sellers have been exhausted during the decline (the cup), and buyers are preparing to push prices higher after a brief pause (the handle). The pattern becomes actionable when price breaks above the resistance level set by the cup's peak. For an authoritative breakdown, check out Investopedia's guide.
Step-by-Step Guide to Trading the Cup and Handle Pattern
Spot, Confirm, and Trade the Cup and Handle Pattern in Crypto Stocks
If you want to capitalize on this bullish continuation setup, here’s how to approach it methodically:
- Identify the Pattern:
- Look for a smooth, rounded 'U' shape on your chosen crypto stock’s chart.
- Ensure the base isn’t too sharp or V-shaped; gradual curves indicate healthy accumulation.
- Watch for a small pullback or sideways drift after price returns to its previous high - this forms your handle. - Confirm with Volume:
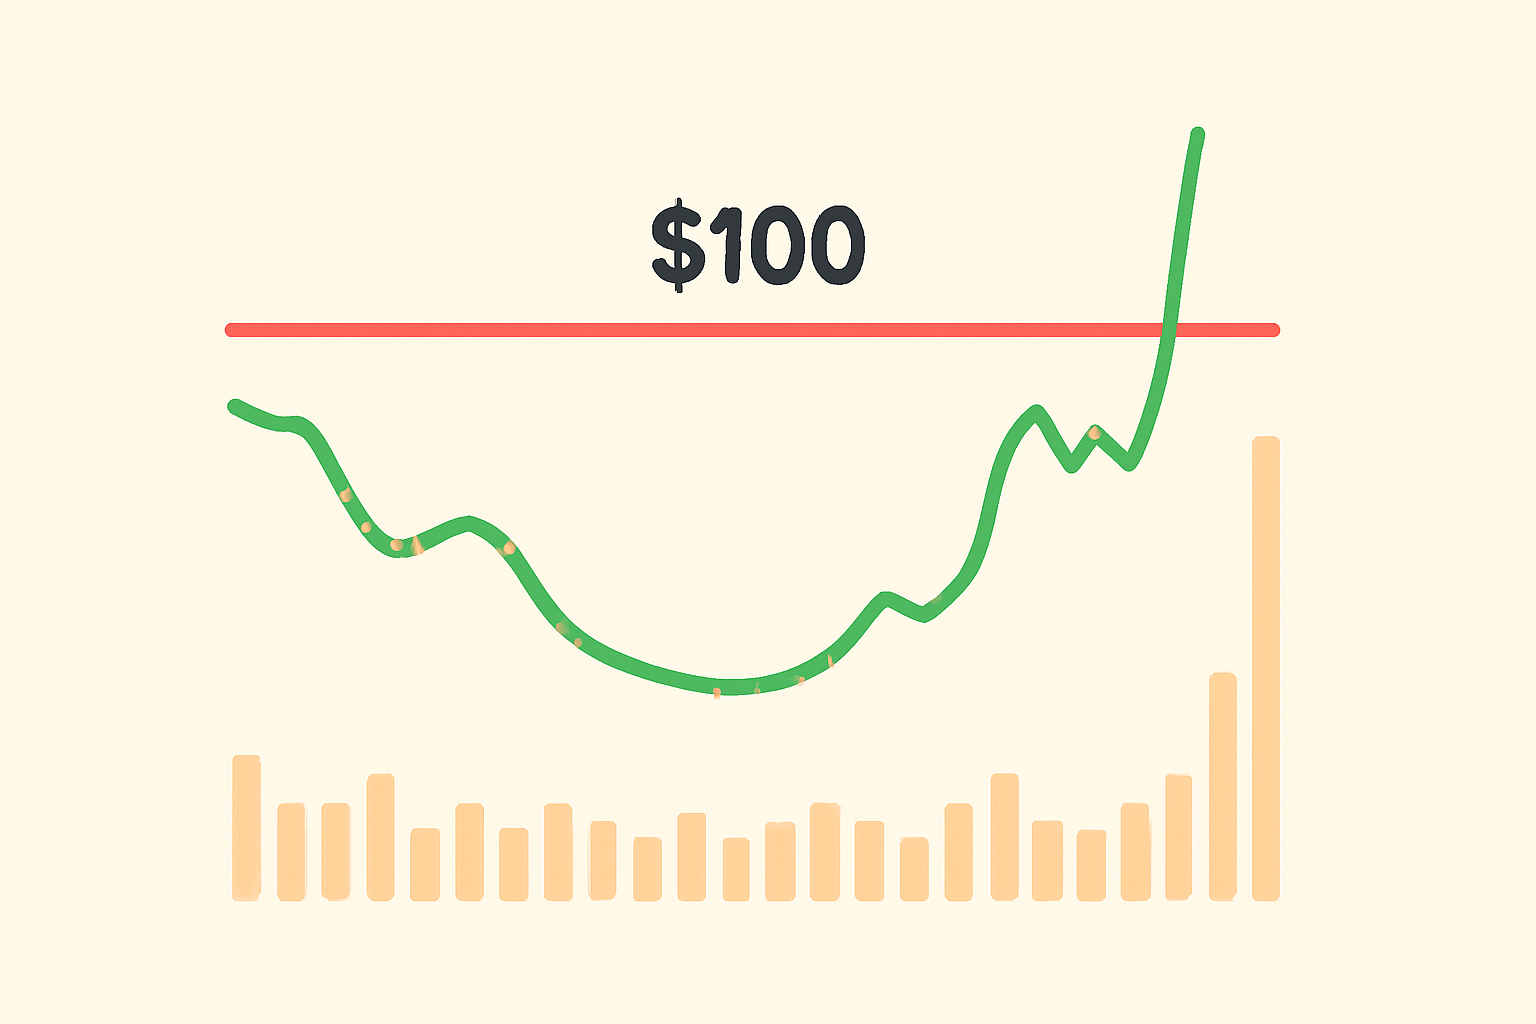
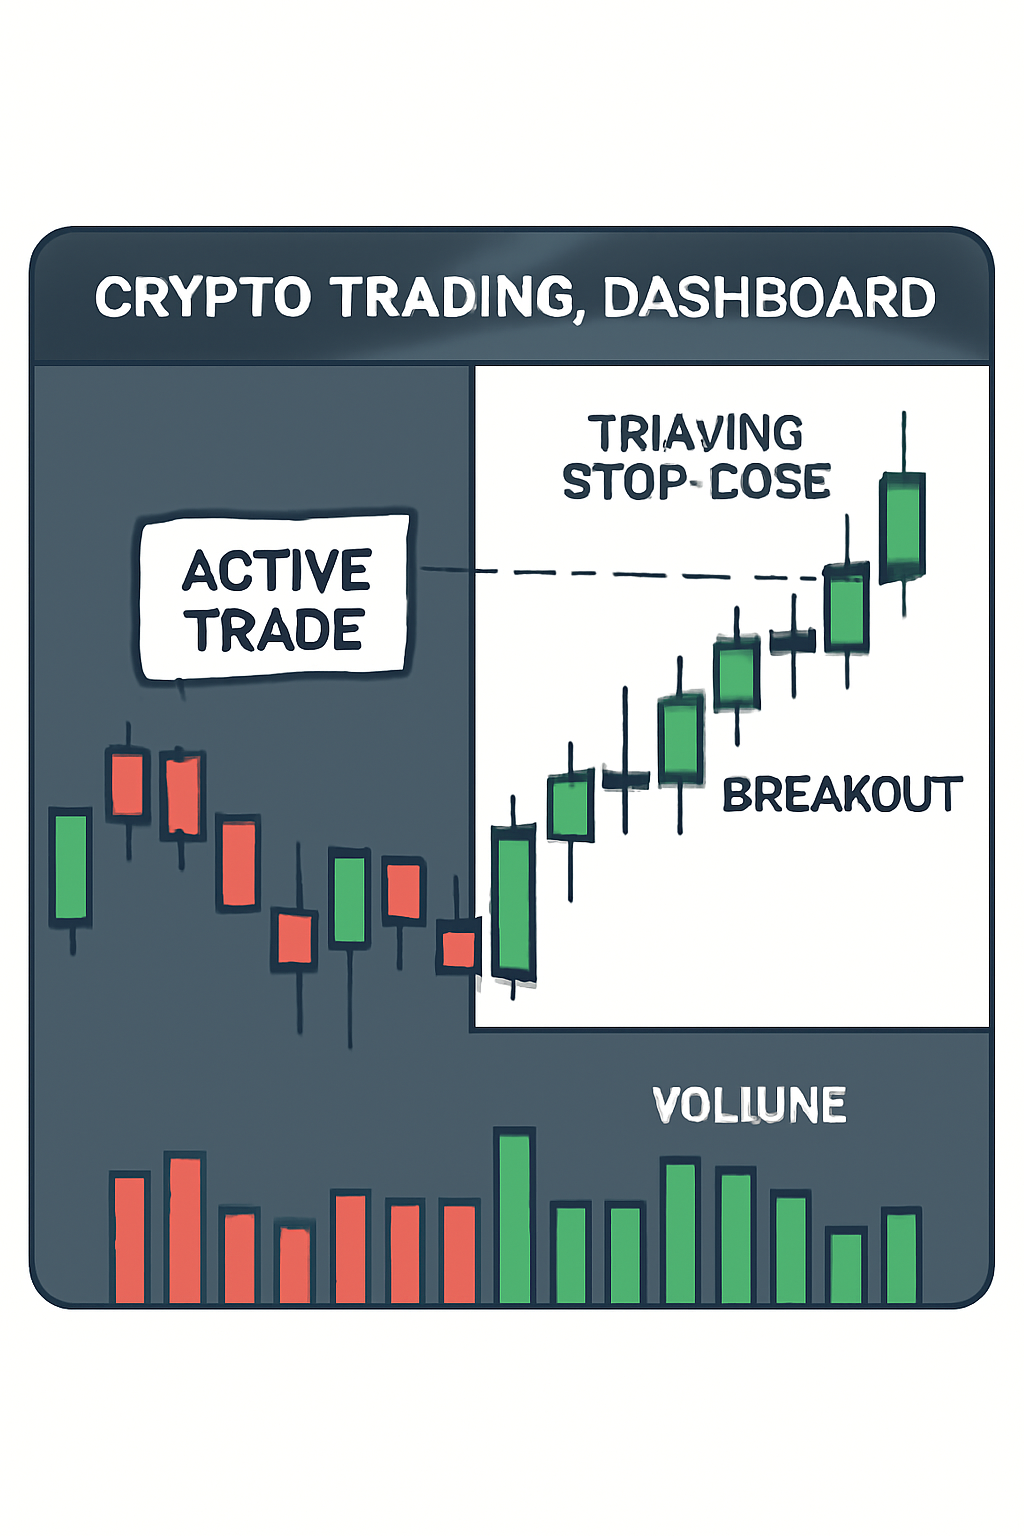
- During both cup and handle formation, volume should taper off.
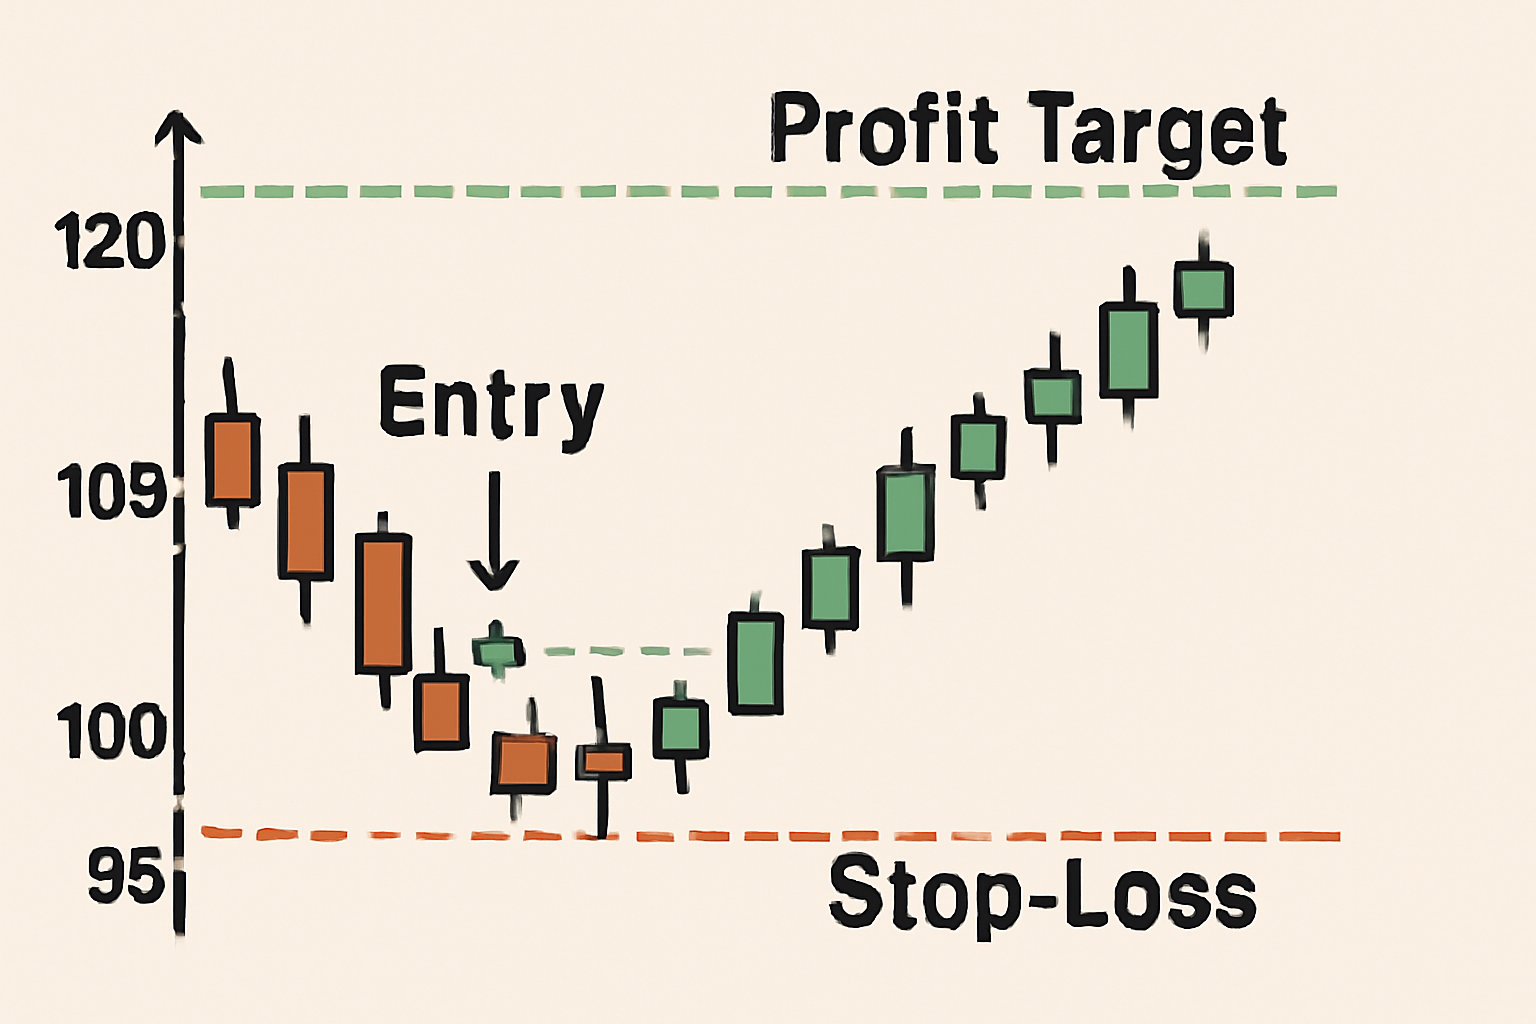
- A true breakout is usually accompanied by a surge in volume as buyers step in. - Set Entry and Exit Points:
- Enter long when price closes above the resistance formed by the top of the cup.
- Place your stop-loss just below the lowest point of the handle to manage risk.
- Calculate your profit target by measuring depth from cup’s bottom to resistance; add this distance above breakout level.
This approach helps you avoid false starts while maximizing profit potential if momentum continues.
Real-World Example: Applying It to Crypto Stocks
Imagine you’re analyzing a popular cryptocurrency that recently declined from $100 to $80. Over several weeks it forms a rounded base (the cup), then rallies back up toward $100. Instead of breaking out immediately, price consolidates between $95 and $100 for several days (the handle). Once price surges above $100 with increased volume, you have confirmation. With a $20 depth from bottom ($80) to resistance ($100), your upside target would be $120 if momentum holds steady.
This isn’t just theory, traders use these precise setups every week across major exchanges. The key is patience: wait for confirmation before jumping in.
But even with a textbook cup and handle pattern crypto setup, no strategy is foolproof. Crypto markets are notorious for their volatility and unpredictability, so risk management is just as important as pattern recognition. Let’s dig deeper into how to protect your capital and maximize your gains when trading this bullish continuation setup.
Risk Management and Common Pitfalls
One of the biggest traps for new traders is leaping into a trade before the breakout is confirmed. False breakouts: where price briefly pops above resistance but quickly reverses, can lead to frustrating losses. To avoid these, always wait for a daily close above the handle’s resistance, ideally accompanied by a clear spike in trading volume.
Another critical mistake: setting stop-loss orders too tight or too loose. Place your stop just below the handle’s low, not the cup’s bottom, to give your trade breathing room while still protecting against sharp reversals. And remember, crypto stocks can gap or wick below support levels during periods of high volatility, so position sizing matters. Never risk more than 1-2% of your trading capital on any single trade.
| Step | Action | Why It Matters 🚀 |
|---|---|---|
| Identify Cup and Handle | Look for rounded base and short pullback | Avoids false patterns |
| Confirm Breakout | Wait for close above resistance, high volume | Cuts down on fakeouts |
| Set Entry and Stop-Loss | Enter after breakout, stop below handle low | Keeps risk controlled |
| Target Profits Smartly | Add cup depth to breakout point for target | Makes exits disciplined, not emotional! |
Advanced Tips: Fine-Tuning Your Strategy in Crypto Stock Trading
If you want to take your technical analysis crypto skills further, consider these advanced tactics:
- Diversify Timeframes: Check multiple timeframes (daily, 4-hour) to confirm that the cup and handle pattern aligns across charts.
- Add Momentum Indicators: Use RSI or MACD to spot overbought/oversold conditions that could strengthen or weaken your setup.
- Pyramiding Positions: If price accelerates after breakout with strong volume, some traders add to their position as confirmation builds, just be sure not to overexpose yourself.
- Avoid Overfitting: Not every rounded dip is a cup! Stick with patterns that meet all criteria: symmetry, proper depth (not too shallow or deep), and clear volume cues.
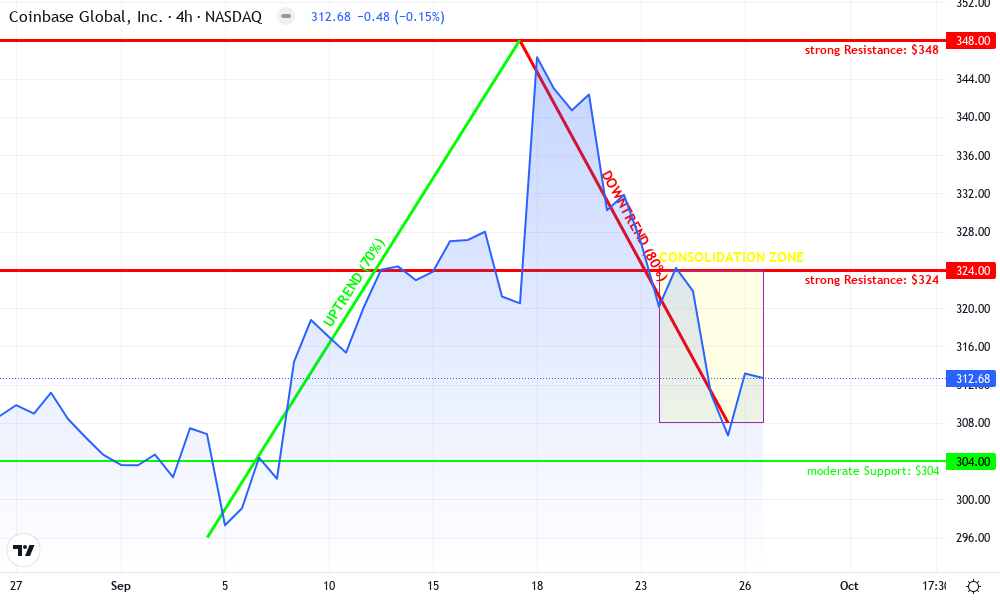
Coinbase Global Inc. Technical Analysis Chart
Analysis by Samantha Leighton | Symbol: NASDAQ:COIN | Interval: 1D | Drawings: 6
Technical Analysis Summary
On this 4-hour chart of Coinbase Global Inc. (COIN), I would draw a horizontal resistance line around $348 (recent swing high) and a horizontal support line near $304 (recent local low). A medium-confidence uptrend line could be drawn from the low on September 5th to the peak on September 18th, followed by a downtrend line from that peak down to the recent low. The chart currently shows a sharp rally followed by a steep correction, suggesting a possible cup-like formation, but the handle is not yet clearly defined. I would highlight the price range between $304 and $348 as the most critical for near-term direction. Entry zones could be marked just above $316 (if price confirms a reversal), with stop-losses just below $304. Use the rectangle tool to shade the consolidation zone between $308 and $324 seen in late September.
Risk Assessment: medium
Analysis: Current market structure is indecisive, with a potential reversal in play but no confirmed breakout. Volatility is elevated after the recent peak and drop. Risk is manageable with well-placed stop-losses.
Samantha Leighton's Recommendation: Watch for a confirmation of support at $304 and a breakout above $324 before committing to a directional trade. Use tight stops and scale in cautiously.
Key Support & Resistance Levels
📈 Support Levels:
- $304 - Recent local low and key psychological level. moderate
📉 Resistance Levels:
- $324 - Recent swing resistance before the last drop. strong
- $348 - Major resistance at the recent peak. strong
Trading Zones (medium risk tolerance)
🎯 Entry Zones:
- $316 - Potential entry if price shows reversal above this level with volume confirmation. medium risk
🚪 Exit Zones:
- $304 - Stop-loss below support to manage downside risk. 🛡️ stop loss
- $324 - First target on reversal move. 💰 profit target
- $348 - Ultimate target if bullish momentum resumes. 💰 profit target
Technical Indicators Analysis
📊 Volume Analysis:
Pattern: Not visible on this chart—should be used for breakout confirmation.
Use callout to note need for volume confirmation on breakouts.
📈 MACD Analysis:
Signal: Not visible—would look for bullish cross near reversal.
MACD bullish cross would support long entry.
Applied TradingView Drawing Utilities
This chart analysis utilizes the following professional drawing tools:
Disclaimer: This technical analysis by Samantha Leighton is for educational purposes only and should not be considered as financial advice. Trading involves risk, and you should always do your own research before making investment decisions. Past performance does not guarantee future results. The analysis reflects the author's personal methodology and risk tolerance (medium).
The real magic happens when you combine classic chart patterns like this with broader market context, such as news catalysts or sector momentum, to stack the odds in your favor. The cup and handle isn’t just about lines on a chart; it’s about understanding crowd psychology at key inflection points in price action.
Join the Conversation: Share Your Cup and Handle Trades!
The best way to master any strategy is by sharing experiences and learning from others. Have you spotted a textbook cup and handle on Bitcoin or another digital asset? Did it play out as expected, or teach you something new about market dynamics?
Have you ever successfully traded the cup and handle pattern in crypto?
The cup and handle is a popular bullish continuation pattern among crypto traders. We're curious about your experience using this strategy—let us know how it's worked for you!
If you’re ready to put this setup into action, keep practicing on demo accounts before risking real capital, and don’t forget to review past trades for continuous improvement. For more details on technical setups like this one, Investopedia offers an excellent resource (see here for more details).
The world of crypto stock trading strategies rewards those who blend patience with precision. By mastering the cup and handle alongside other proven techniques, you’re building an edge that can last through bull runs and bear dips alike.
No comments yet. Be the first to share your thoughts!