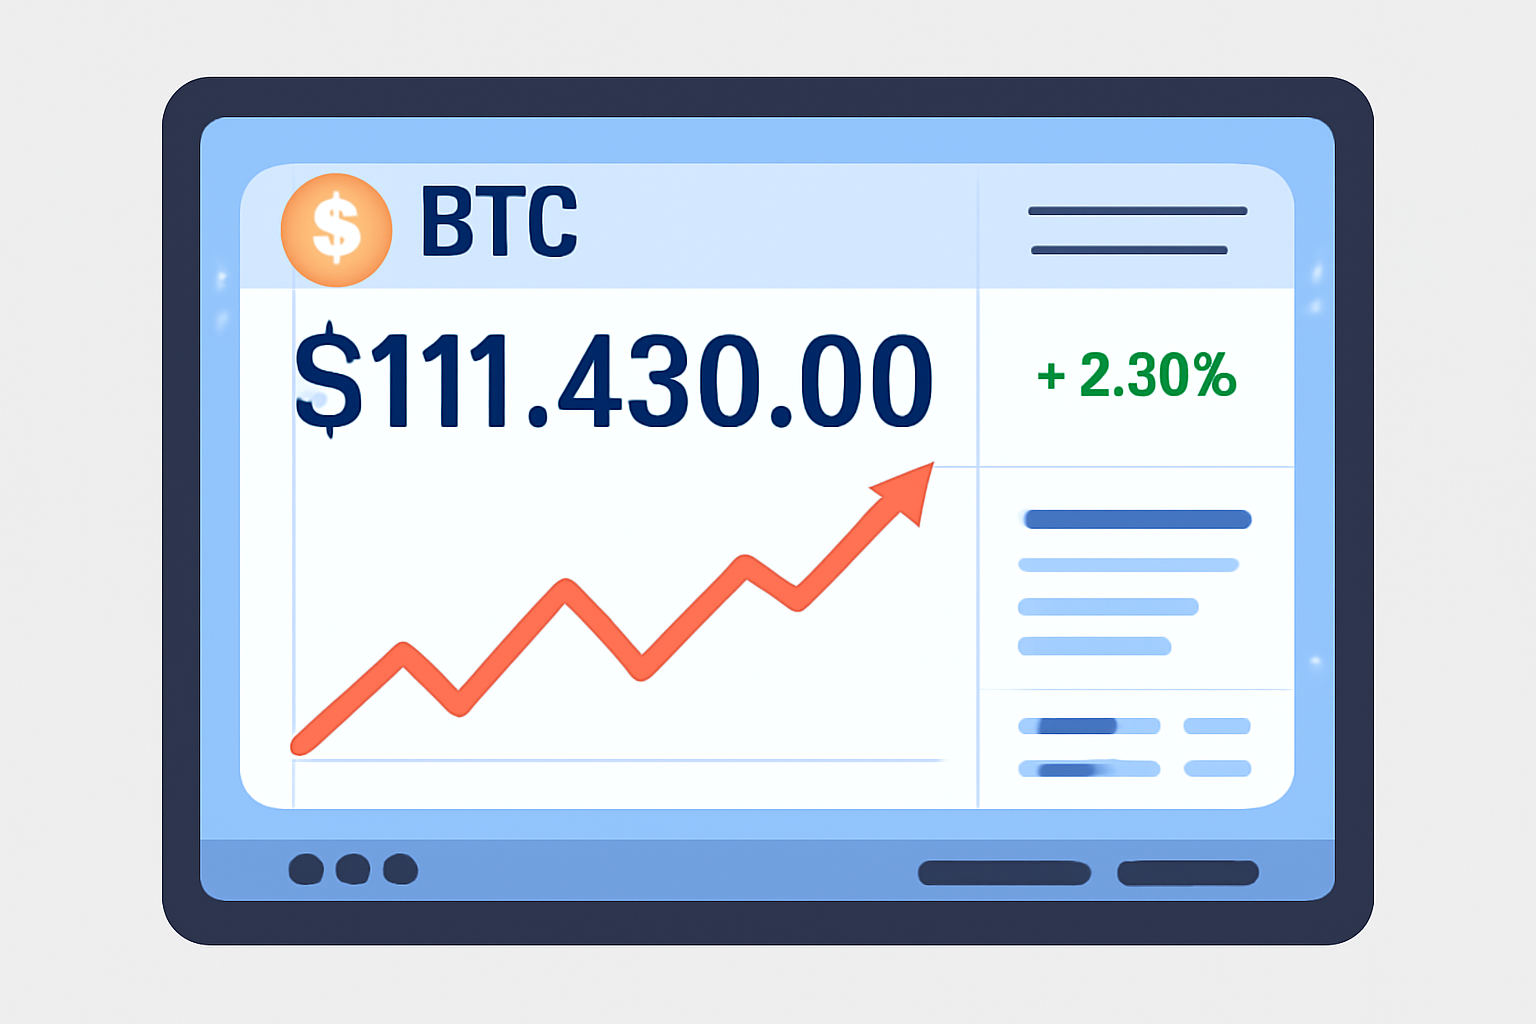
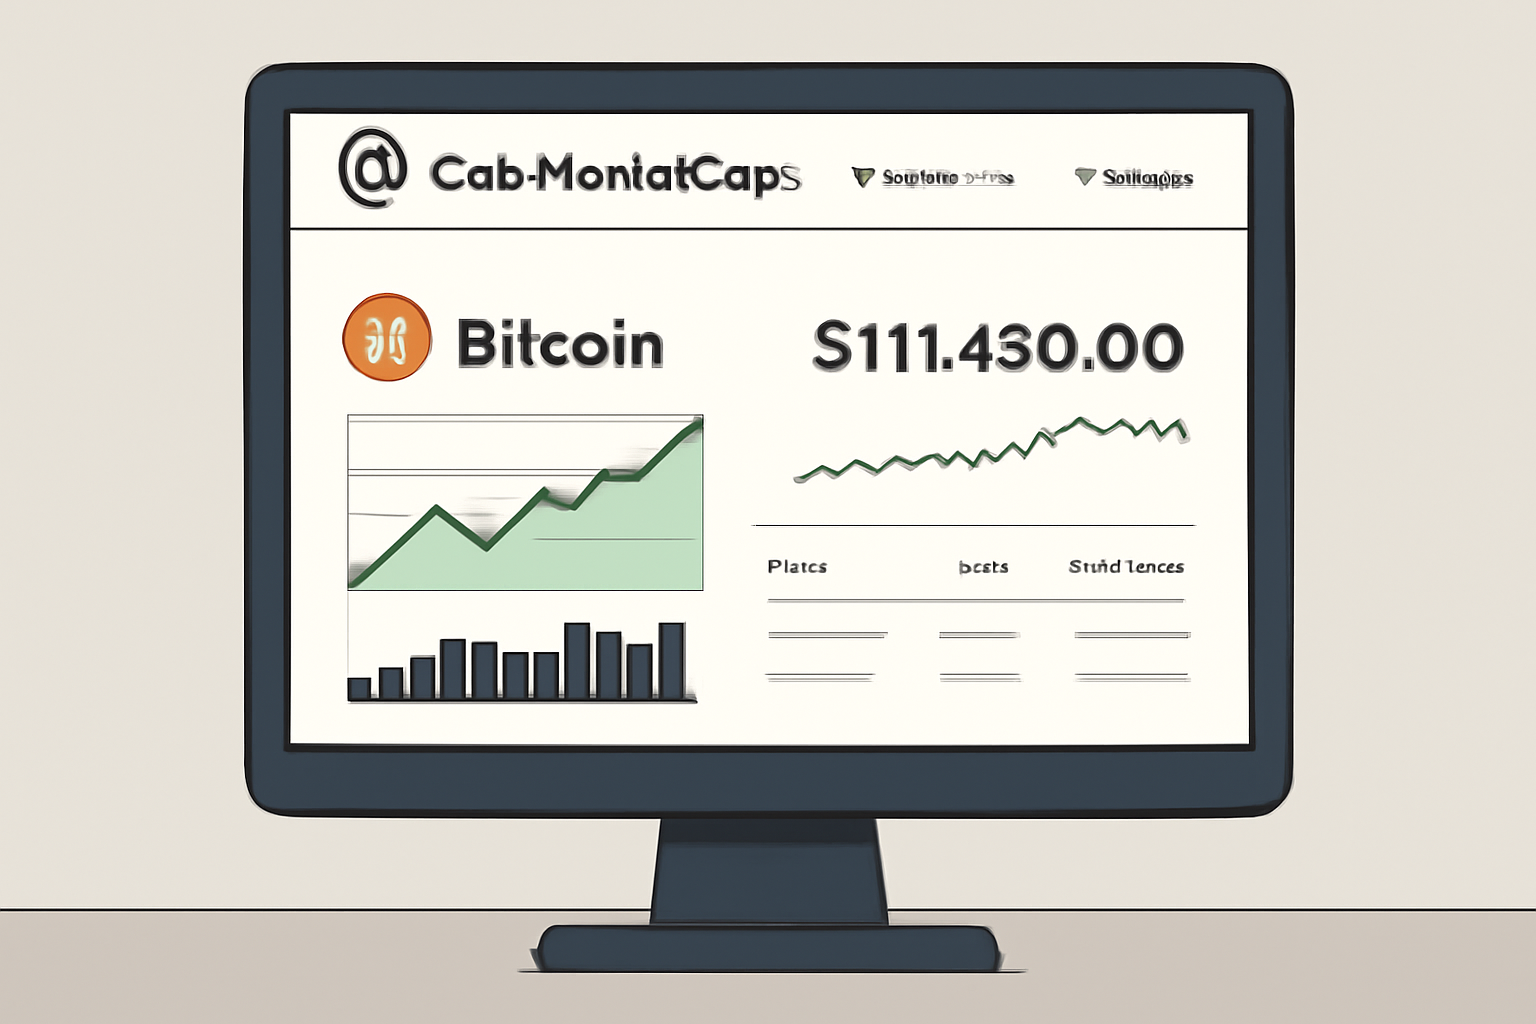
Day trading in the crypto stock market is a game of speed, precision, and real-time insight. In a space where Bitcoin is currently trading at $111,430.00 and daily swings can exceed $2,500, having the right tools to track live prices and act instantly is not just an advantage, it’s a necessity. The difference between a profitable trade and a missed opportunity often comes down to how quickly you can access and interpret real-time crypto stock prices.

Why Real-Time Crypto Stock Prices Matter for Day Traders
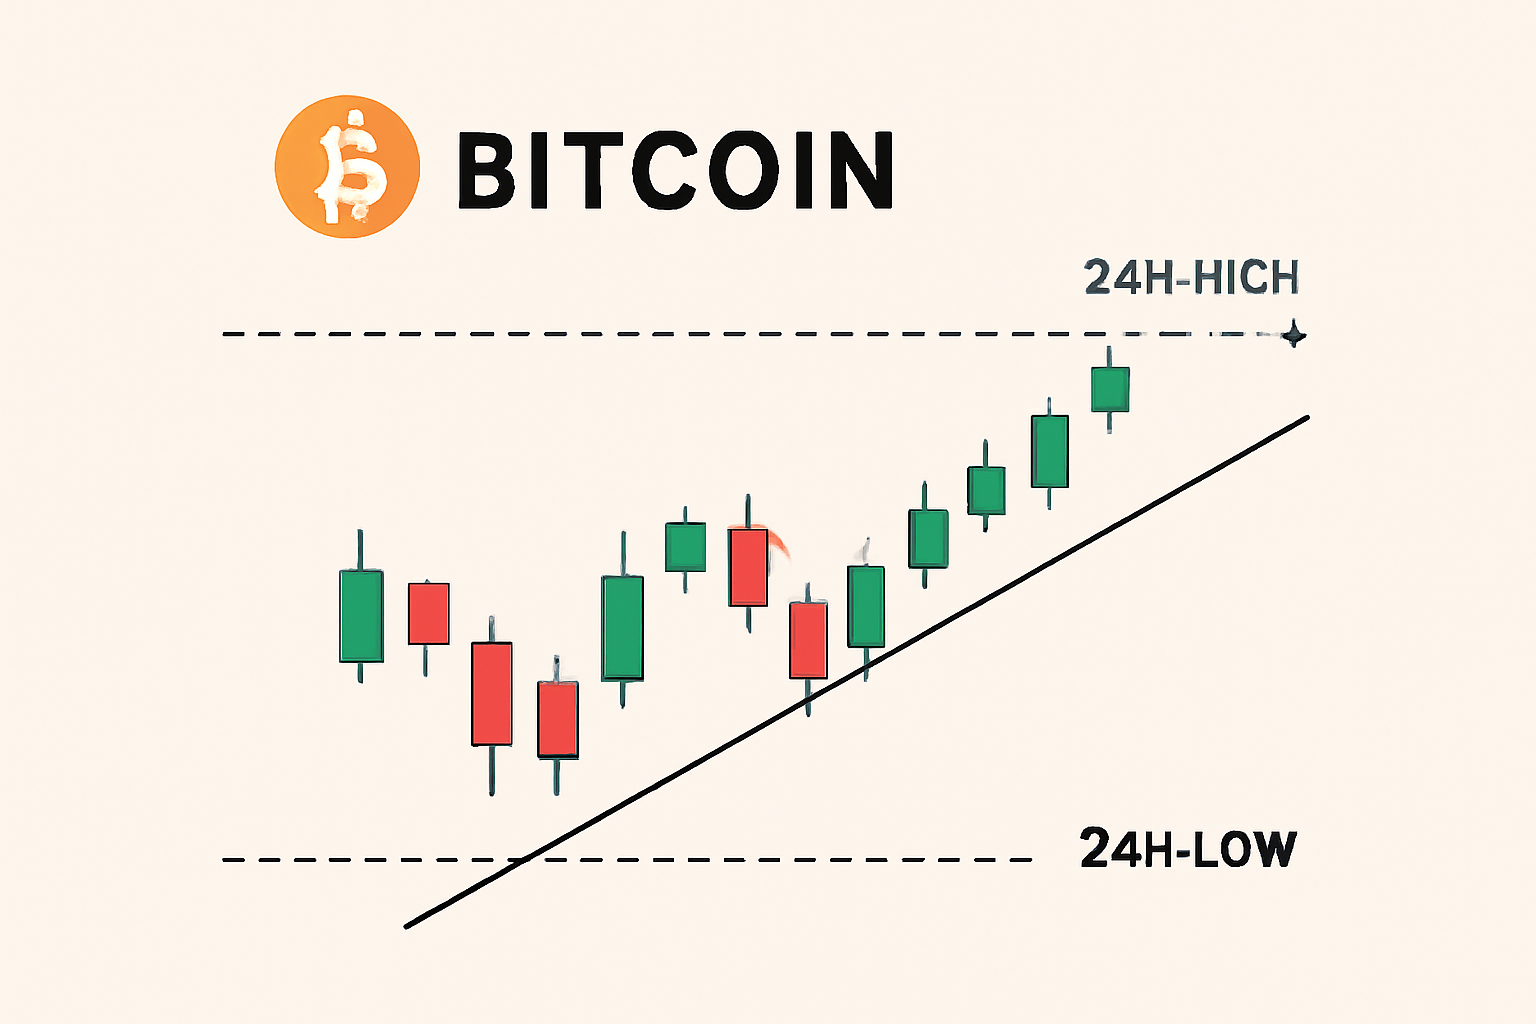
Every second counts in crypto day trading. With volatility at historic highs and liquidity moving across exchanges, you need to know exactly where the market stands before executing a trade. For instance, Bitcoin’s recent 24-hour range from $108,848.00 to $111,680.00 highlights just how quickly fortunes can change. Real-time data feeds allow traders to:
- Spot breakout opportunities as they happen
- React instantly to news-driven price shocks
- Set precise entry and exit points based on live order book dynamics
But not all data sources are created equal. To optimize your strategy, you need a curated set of platforms and tools that deliver both speed and actionable analytics.
Essential Tools for Tracking Live Crypto Stock Data
Top 5 Real-Time Crypto Price Tracking Tools
-
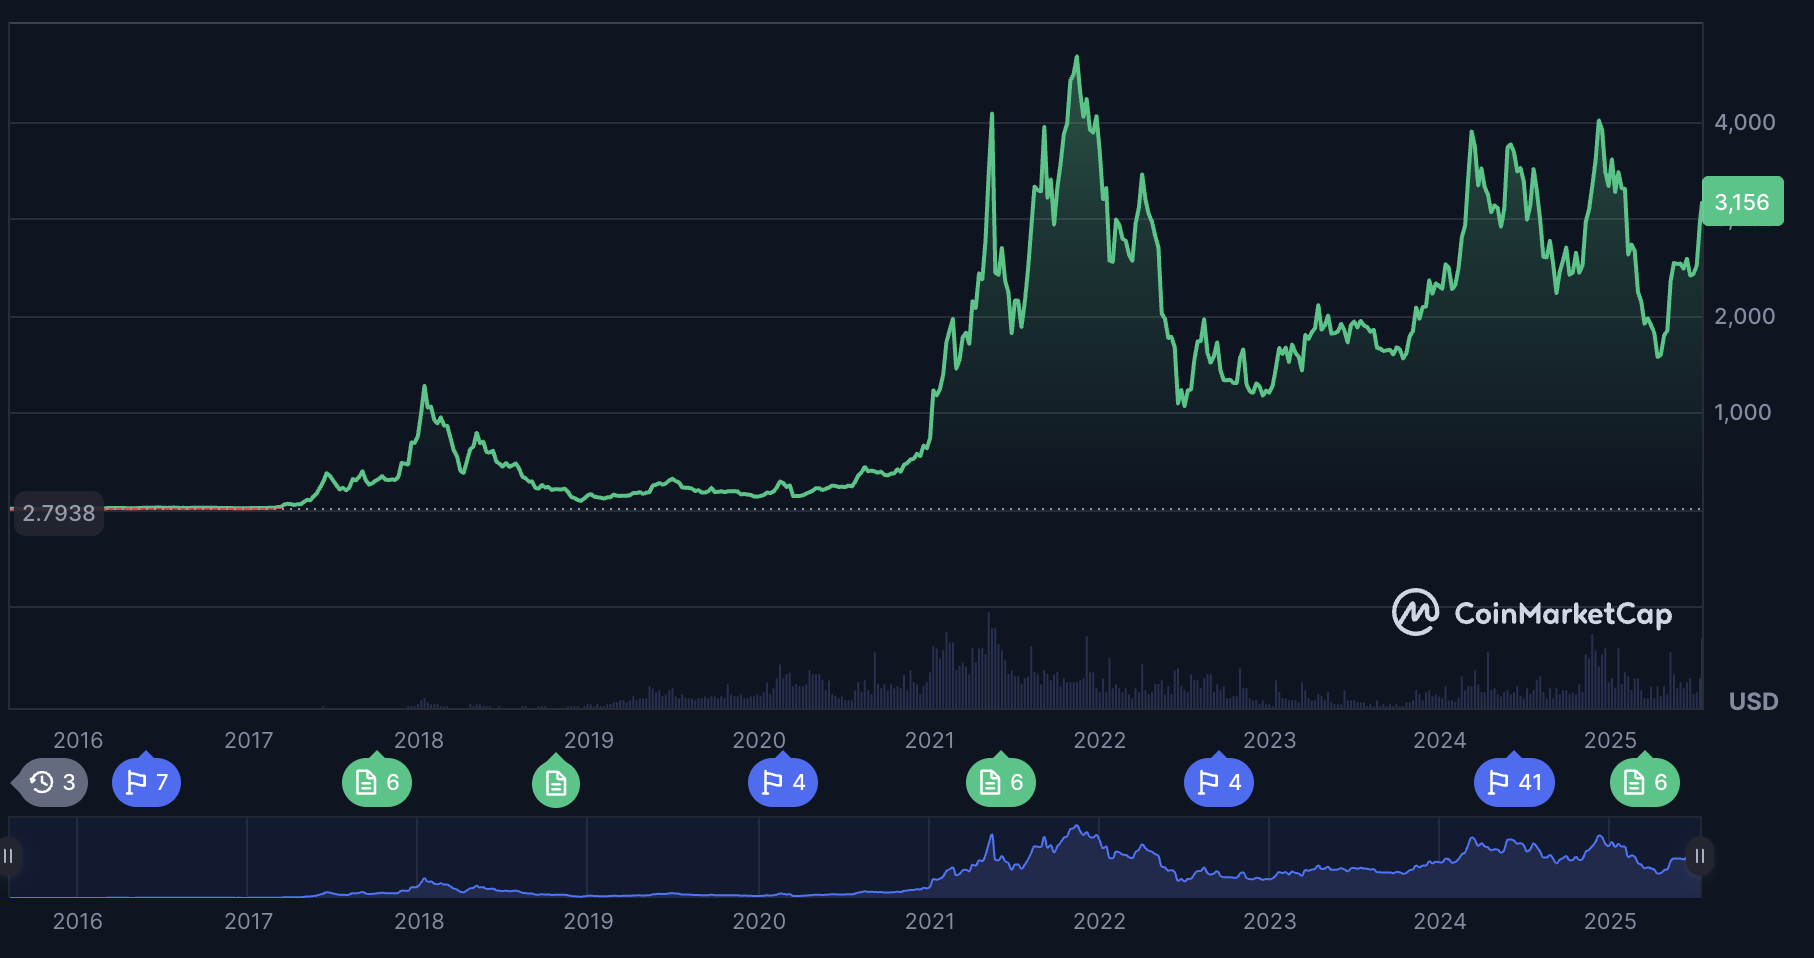
CoinMarketCap: Utilize CoinMarketCap’s real-time API and web platform to access live cryptocurrency prices, market capitalization, and trading volumes across thousands of coins and tokens. CoinMarketCap is a trusted source for up-to-the-minute data, helping day traders make informed decisions based on accurate market metrics.
-
TradingView: Leverage TradingView’s advanced charting tools for in-depth technical analysis, customizable alerts, and integration with multiple crypto exchanges for real-time price tracking. Its user-friendly interface and robust community make it a favorite among active traders seeking strategic insights.
-
Investing.com Crypto Dashboard: Monitor live crypto stock prices, comprehensive market overviews, and set up real-time notifications to react instantly to price movements. Investing.com’s dashboard is ideal for keeping tabs on major coins and market trends in a single, streamlined interface.
-
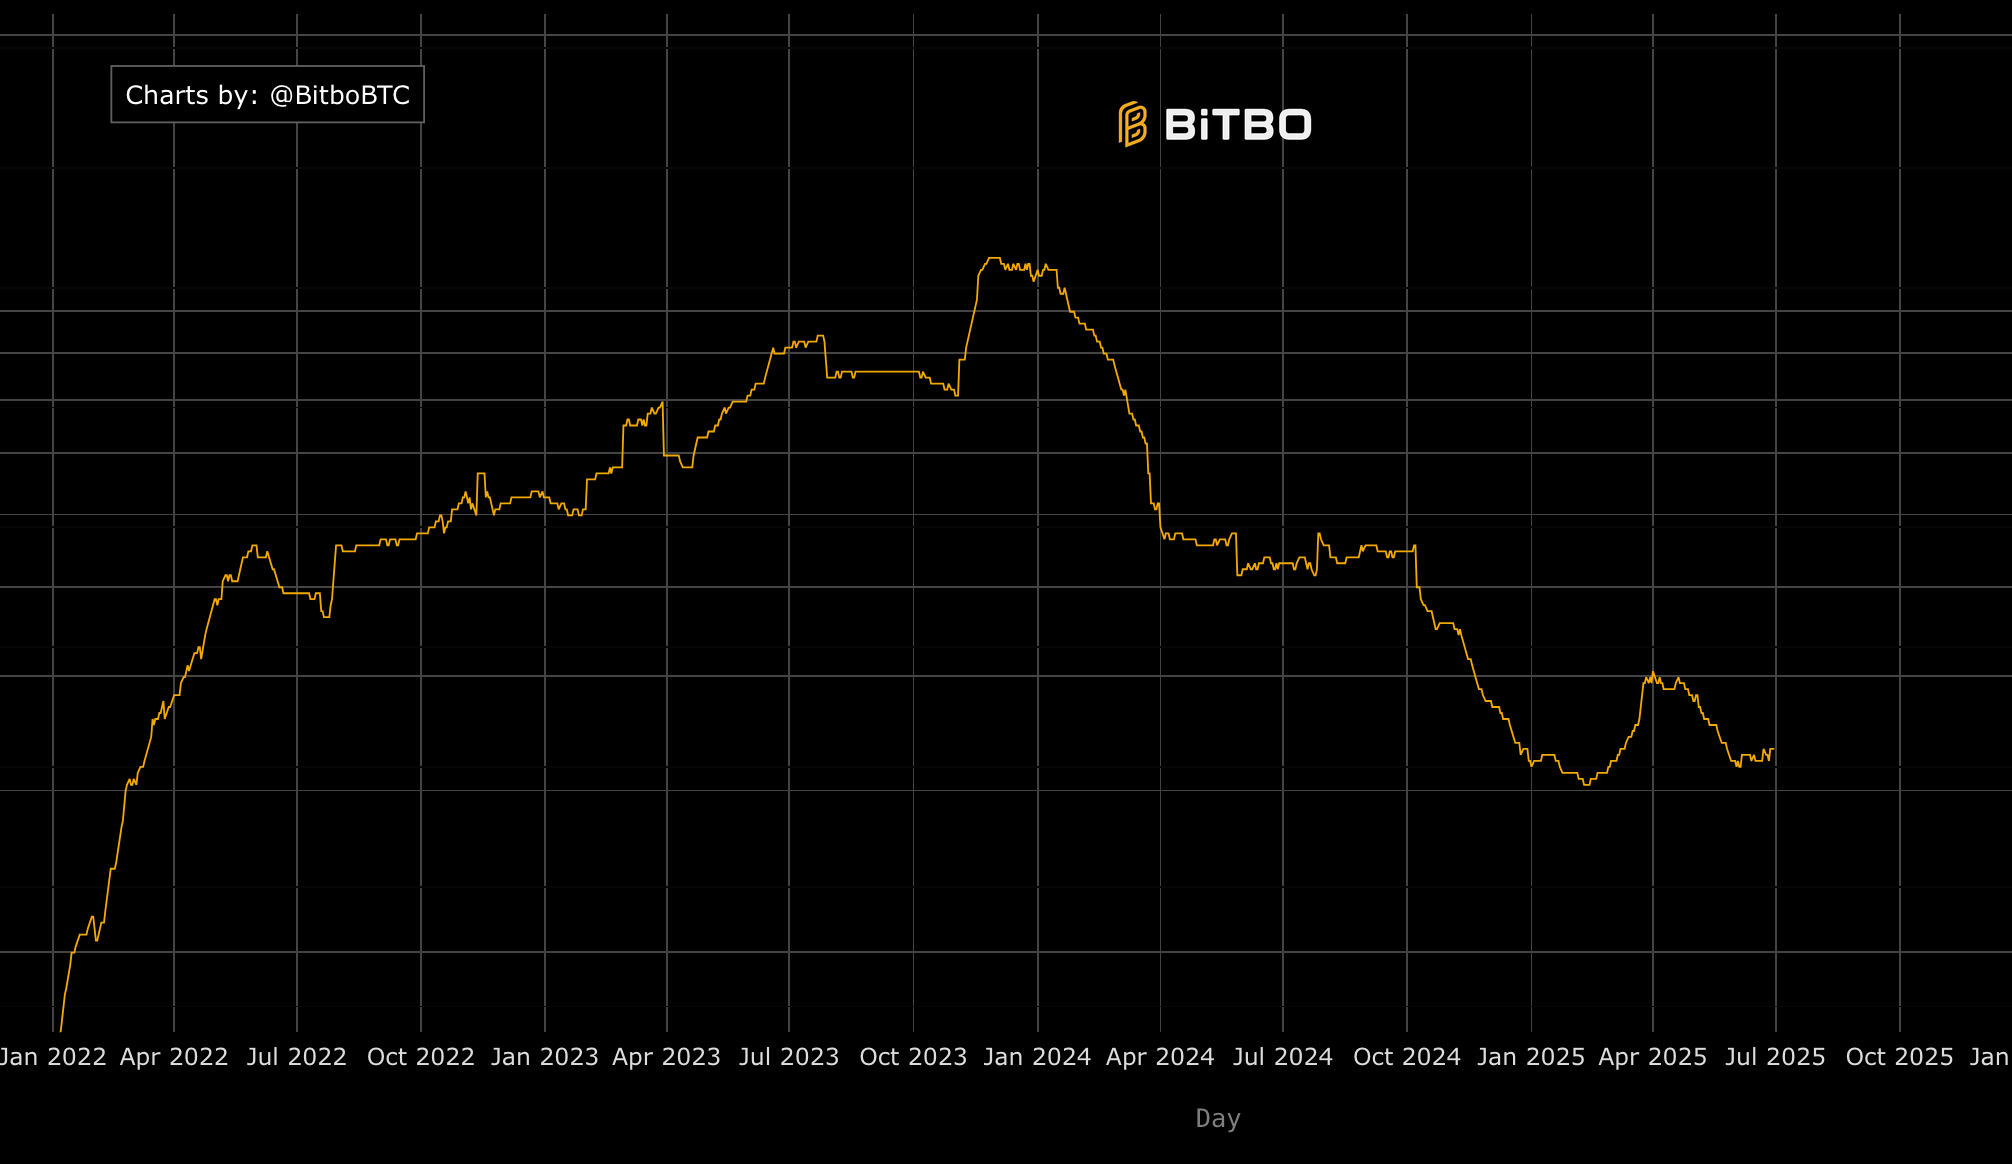
Bitbo: Use Bitbo for live Bitcoin price action, on-chain analytics, and economic indicators to inform short-term trading decisions. Bitbo provides real-time updates and visualizations specifically tailored for Bitcoin day traders.
-
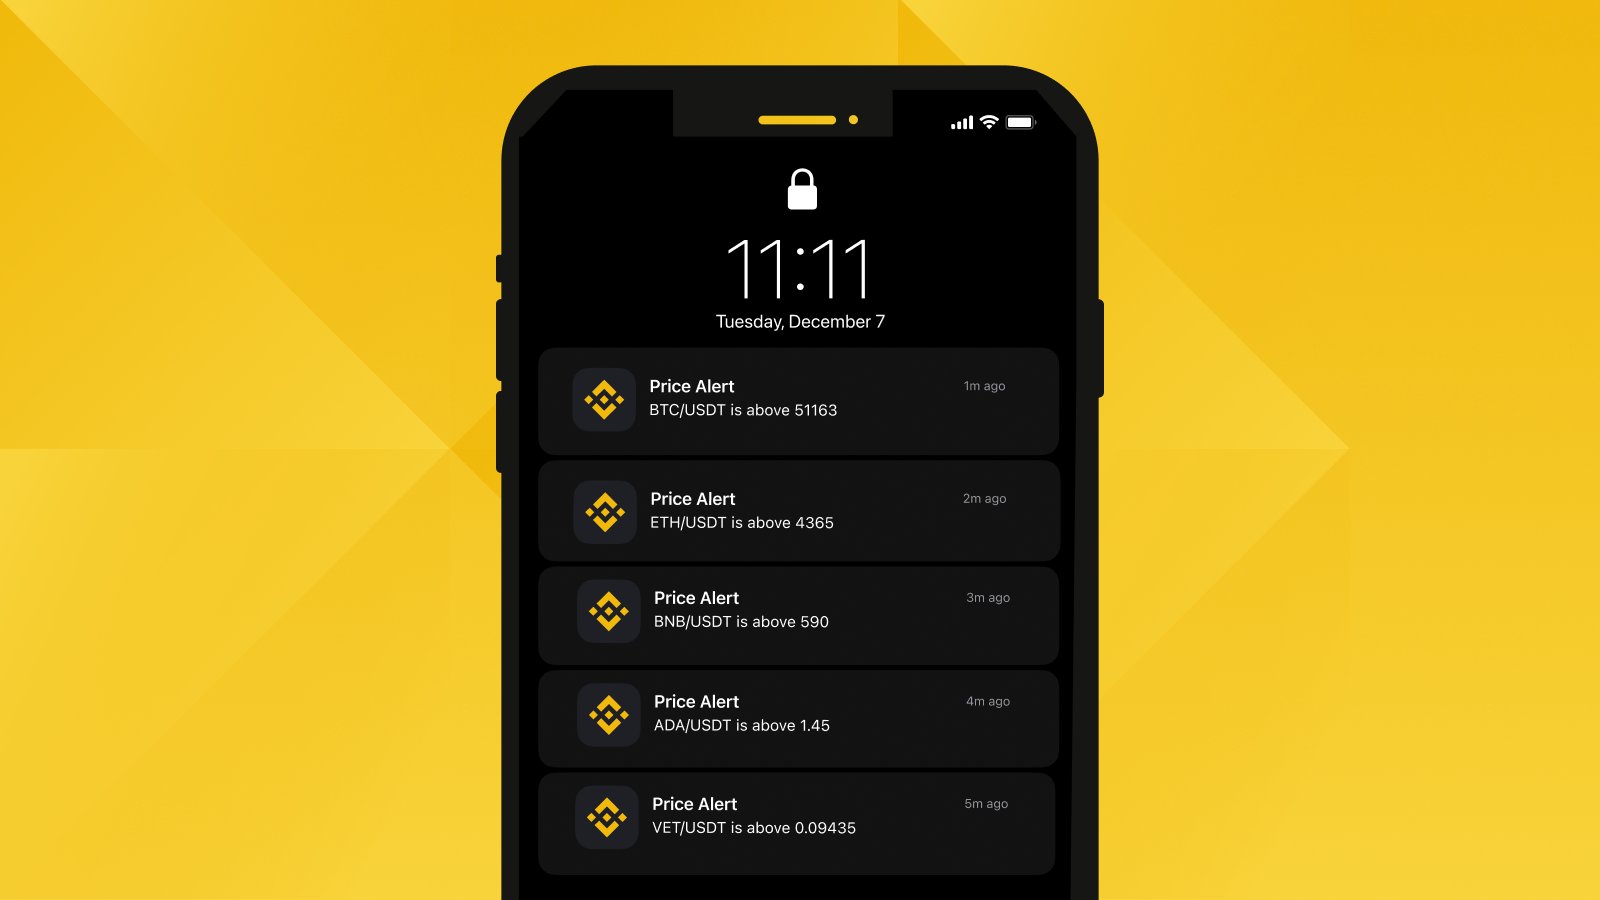
Set Up Custom Price Alerts: Implement price alert systems (via platforms like Binance or Coinbase) to receive instant notifications when specific price targets or volatility thresholds are reached. This ensures you never miss critical trading opportunities in the fast-moving crypto market.
Let’s break down the most effective platforms every active trader should have in their arsenal:
1. CoinMarketCap: The Backbone of Real-Time Crypto Market Data
CoinMarketCap is the industry standard for tracking live cryptocurrency prices, market capitalization, and trading volumes across thousands of coins and tokens. Its real-time API is a favorite among algorithmic traders and portfolio managers for its reliability and depth of coverage. The web platform also features comprehensive charts and historical data, making it indispensable for both quick checks and deeper analysis.
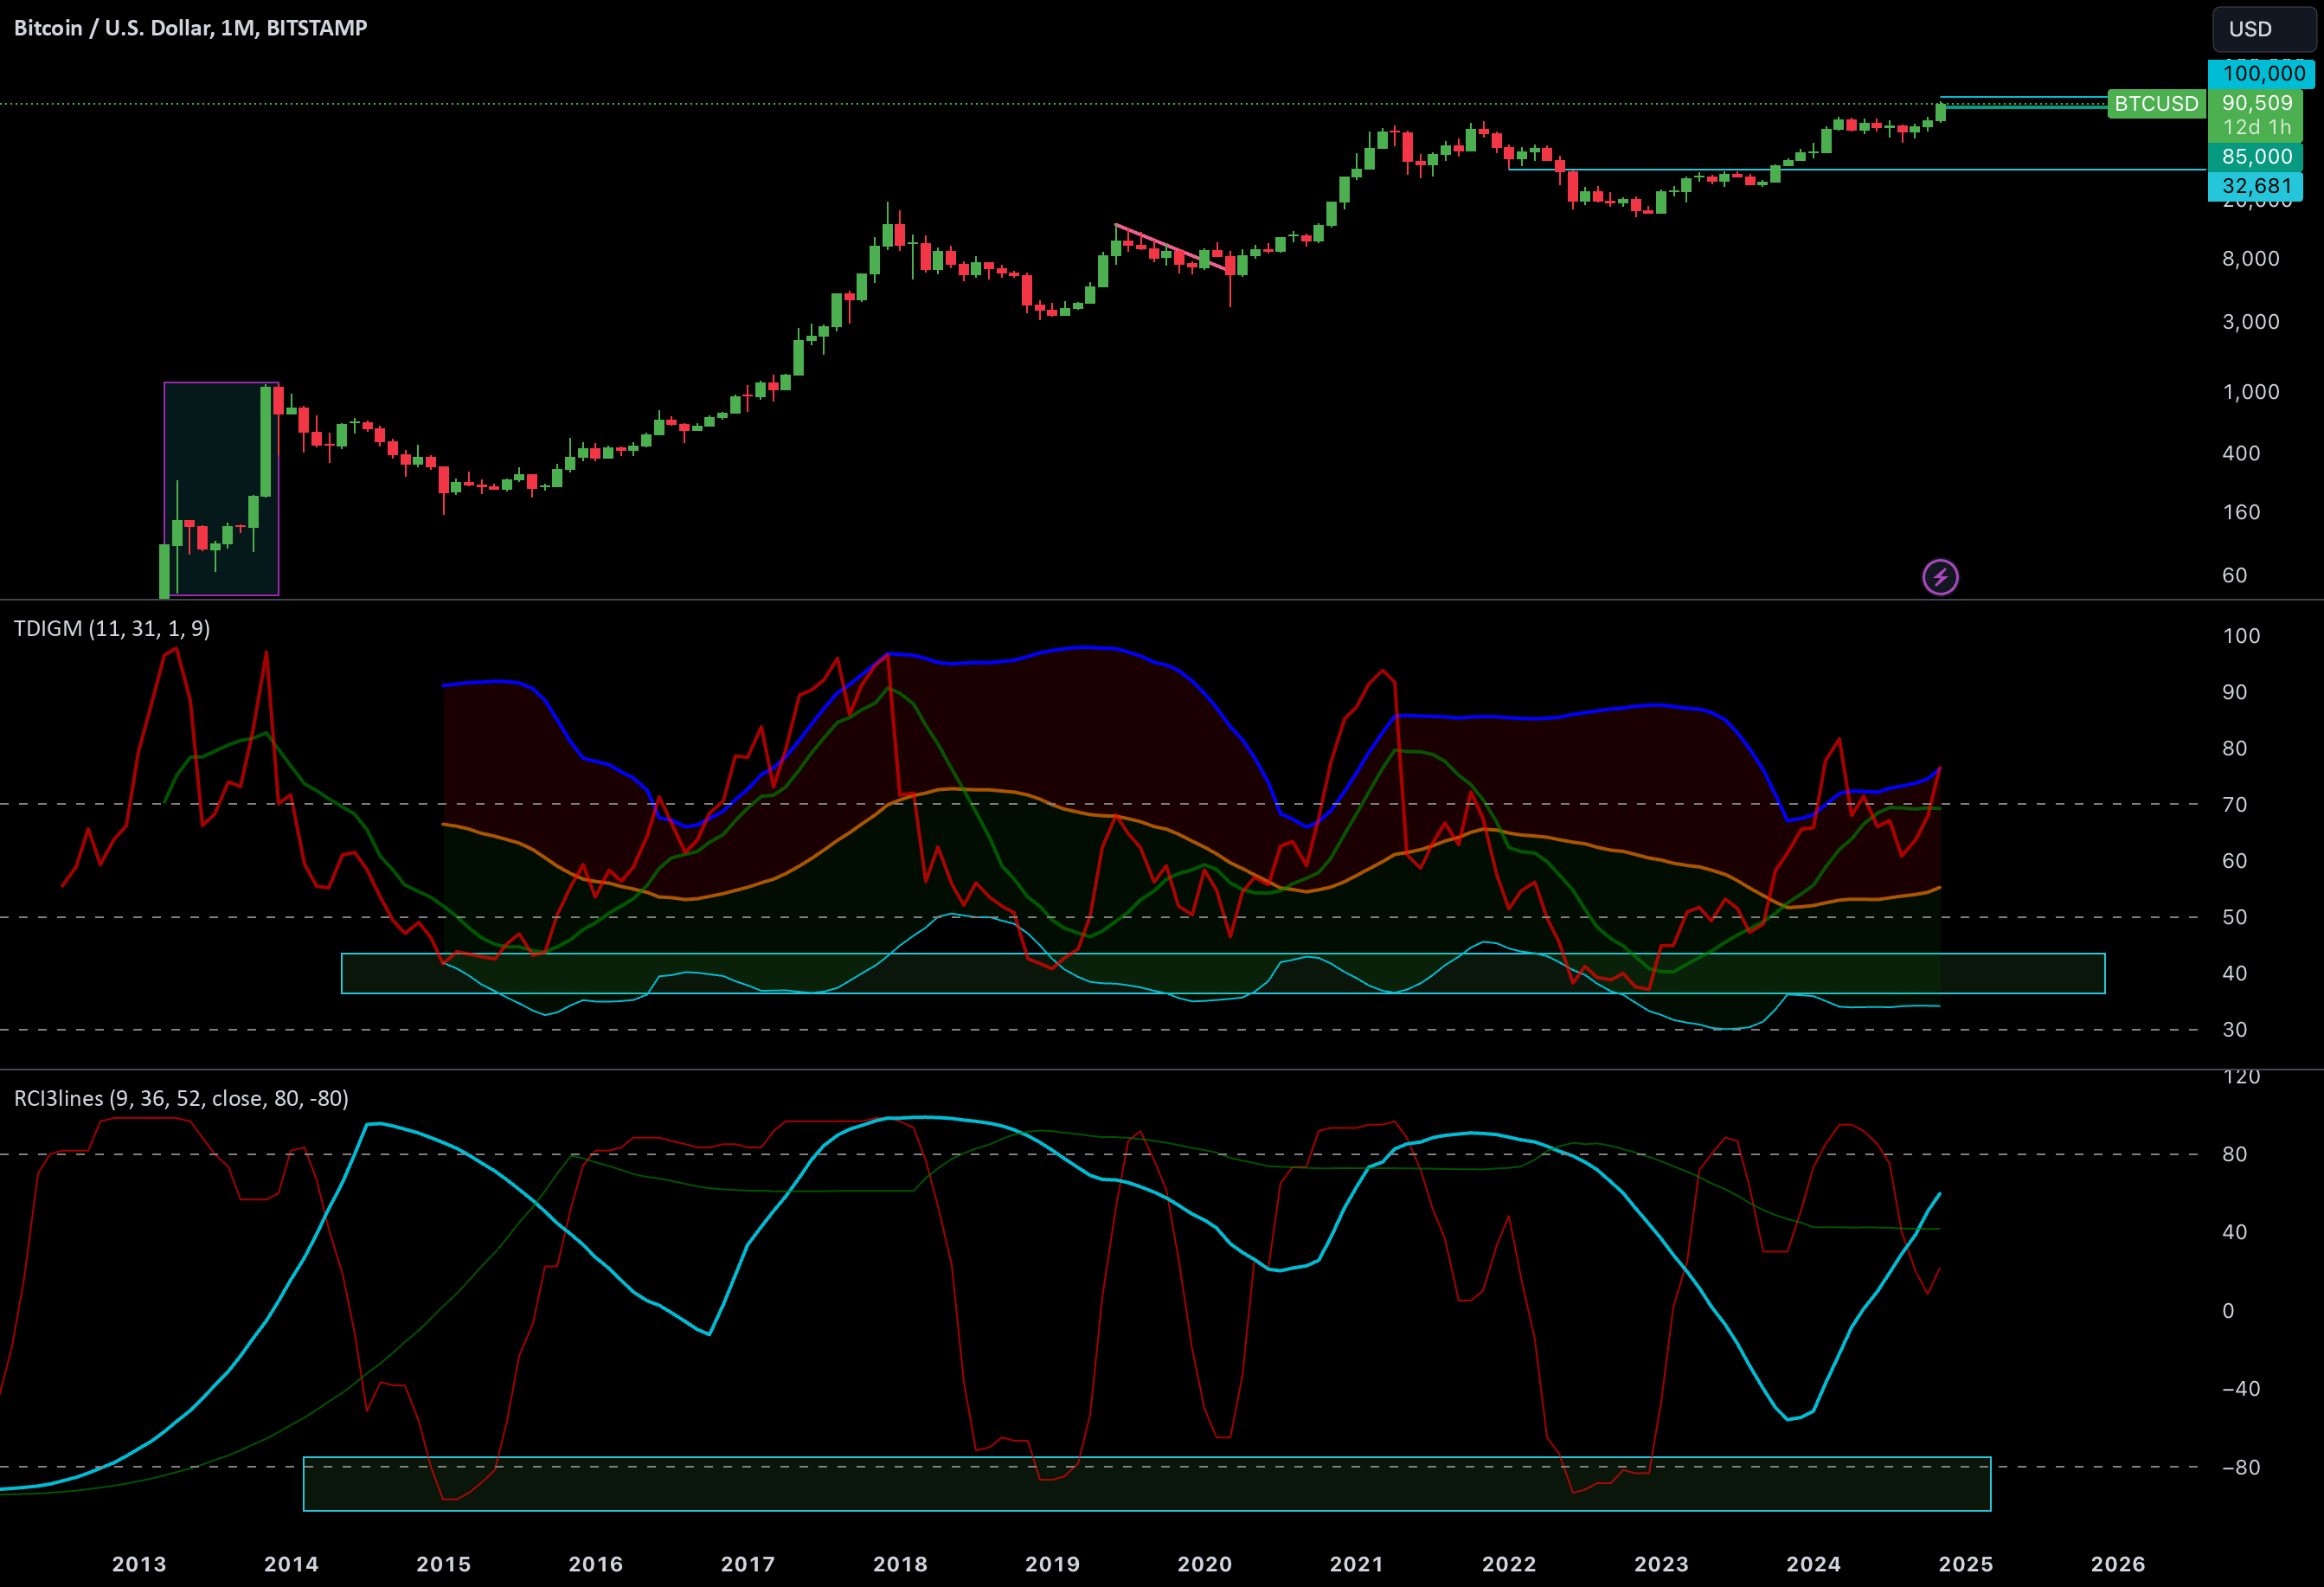
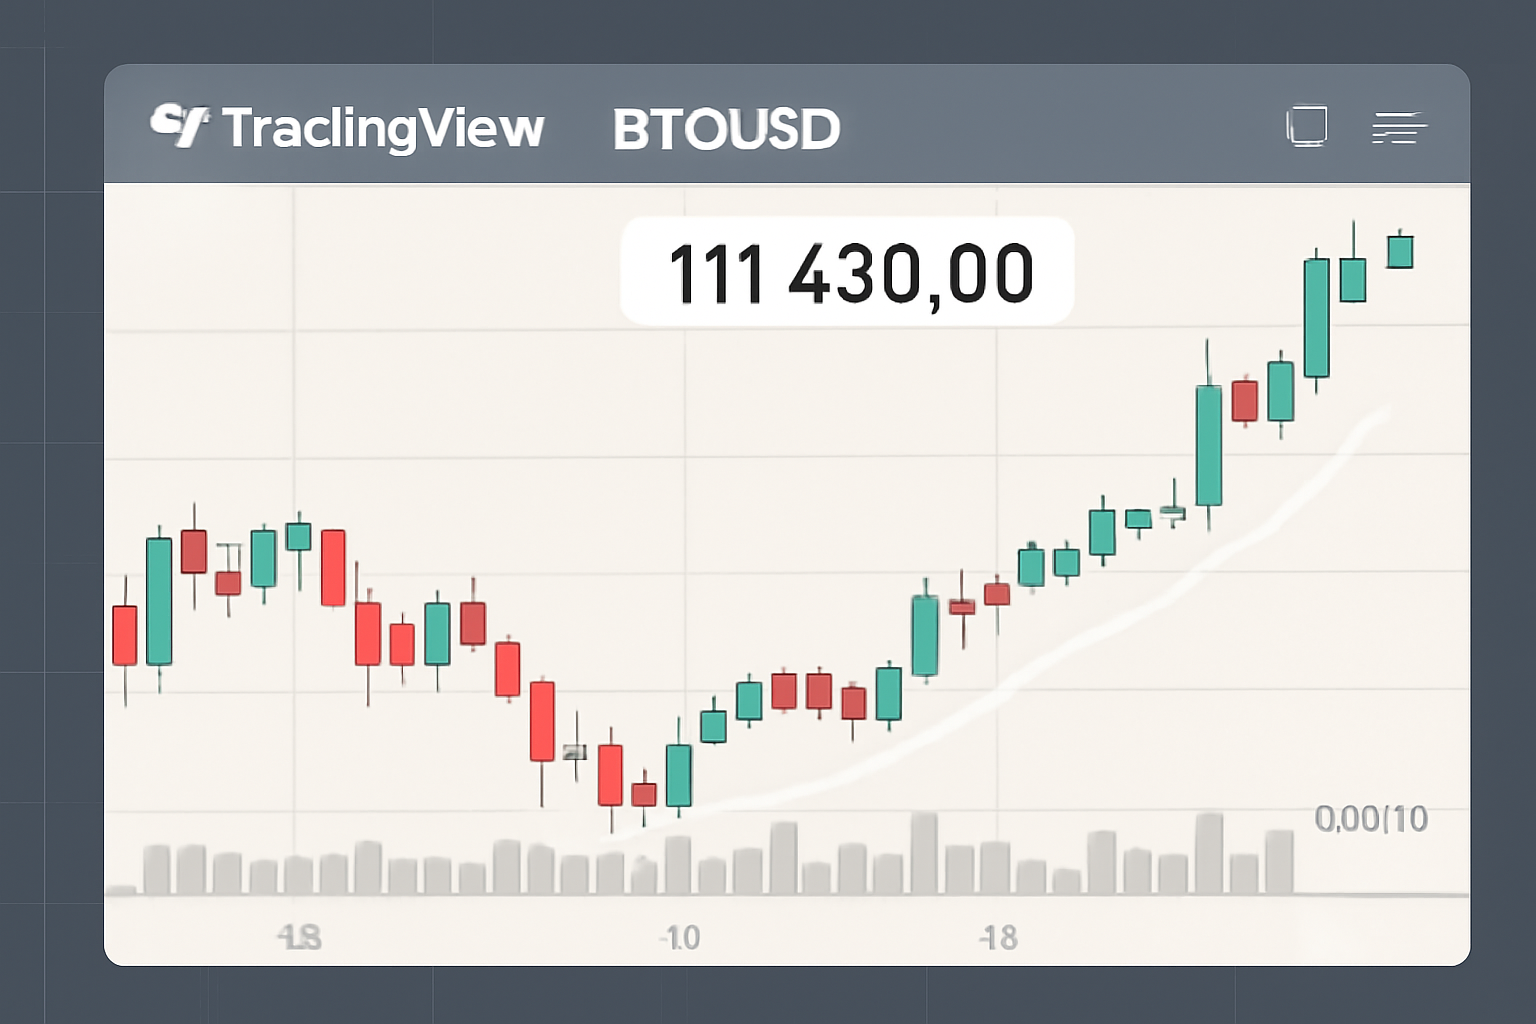
2. TradingView: Advanced Charting and Custom Alerts
When it comes to technical analysis, TradingView stands out for its customizable charting tools and seamless integration with multiple crypto exchanges. Whether you’re tracking Bitcoin’s price action at $111,430.00 or scanning altcoins for momentum shifts, TradingView’s interface lets you set up real-time alerts on specific price levels or indicator triggers. The platform’s social features also enable you to tap into community sentiment and crowd-sourced strategies.
Bitcoin Technical Analysis Chart
Analysis by Jessica Navarro | Symbol: BINANCE:BTCUSDT | Interval: 1W | Drawings: 6
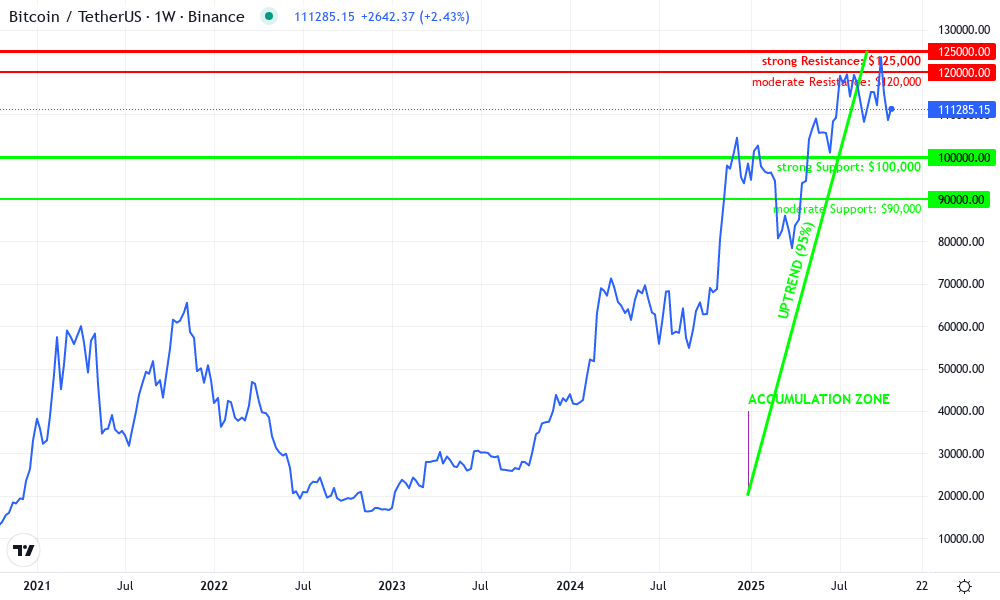
Technical Analysis Summary
Begin by drawing a primary uptrend line from the 2023 lows (just above $20,000) to the 2025 highs, touching the major swing lows. Add horizontal lines at the major resistance zone near $125,000 and at support around $100,000. Mark the current price at $111,193.50 with a horizontal line. Highlight the consolidation range between $100,000 and $125,000 for late 2025 with a rectangle. Use callouts to indicate potential accumulation zones near $100,000 and distribution zones above $120,000.
Risk Assessment: medium
Analysis: Despite strong long-term fundamentals, the current price is extended after a steep rally. There is a risk of profit-taking and retracement from these levels. Only consider new positions on significant pullbacks to strong support.
Jessica Navarro’s Recommendation: Wait for a correction toward the $100,000 support zone before accumulating. Avoid chasing price at all-time highs. Maintain robust risk management and preserve capital for better opportunities.
Key Support & Resistance Levels
📈 Support Levels:
-
$100,000 – Psychological and recent consolidation support zone
strong -
$90,000 – Previous breakout level and dip buy interest
moderate
📉 Resistance Levels:
-
$125,000 – All-time high zone; heavy selling and profit-taking evident
strong -
$120,000 – Recent swing high, possible interim resistance
moderate
Trading Zones (low risk tolerance)
🎯 Entry Zones:
-
$100,000 – Conservative accumulation near major support, after a pullback
low risk -
$90,000 – Oversold scenario or macro-driven correction; strong value zone
low risk
🚪 Exit Zones:
-
$125,000 – Major resistance and likely distribution zone
💰 profit target -
$95,000 – Breakdown below $100,000 support would trigger a stop for downside protection
🛡️ stop loss
Technical Indicators Analysis
📊 Volume Analysis:
Pattern: Volumes likely expanded into the 2025 rally, but may be declining in recent consolidation, signaling caution.
Watch for declining volume as price consolidates near highs—risk of exhaustion.
📈 MACD Analysis:
Signal: Monitor for bearish cross or divergence; momentum may be waning after parabolic run.
MACD likely at elevated levels; wait for confirmation of new trend before adding exposure.
Applied TradingView Drawing Utilities
This chart analysis utilizes the following professional drawing tools:
Disclaimer: This technical analysis by Jessica Navarro is for educational purposes only and should not be considered as financial advice.
Trading involves risk, and you should always do your own research before making investment decisions.
Past performance does not guarantee future results. The analysis reflects the author’s personal methodology and risk tolerance (low).
3. Investing. com Crypto Dashboard: Market Overviews and Instant Notifications
The Investing. com Crypto Dashboard is designed for traders who need a holistic view of the market alongside granular price data. Its dashboard provides a live snapshot of top movers, overall market capitalization, and trading volumes. The ability to set up real-time notifications means you’ll never miss a critical move – whether it’s Bitcoin breaking above $111,000 or a sudden spike in trading volume on a trending altcoin.
Going Deeper: Specialized Tools for Enhanced Day Trading Precision
Beyond the broad market platforms, specialist tools offer unique advantages for active traders who want to drill down into specific assets or automate their response to price changes.
4. Bitbo: Live Bitcoin Price Action and On-Chain Analytics
Bitbo is a focused resource for those who trade Bitcoin intensively. It combines live BTC price feeds (currently at $111,430.00) with on-chain analytics like transaction volumes and economic indicators – crucial for understanding supply-demand dynamics in real time. This granular approach helps day traders anticipate moves before they appear on broader market dashboards.
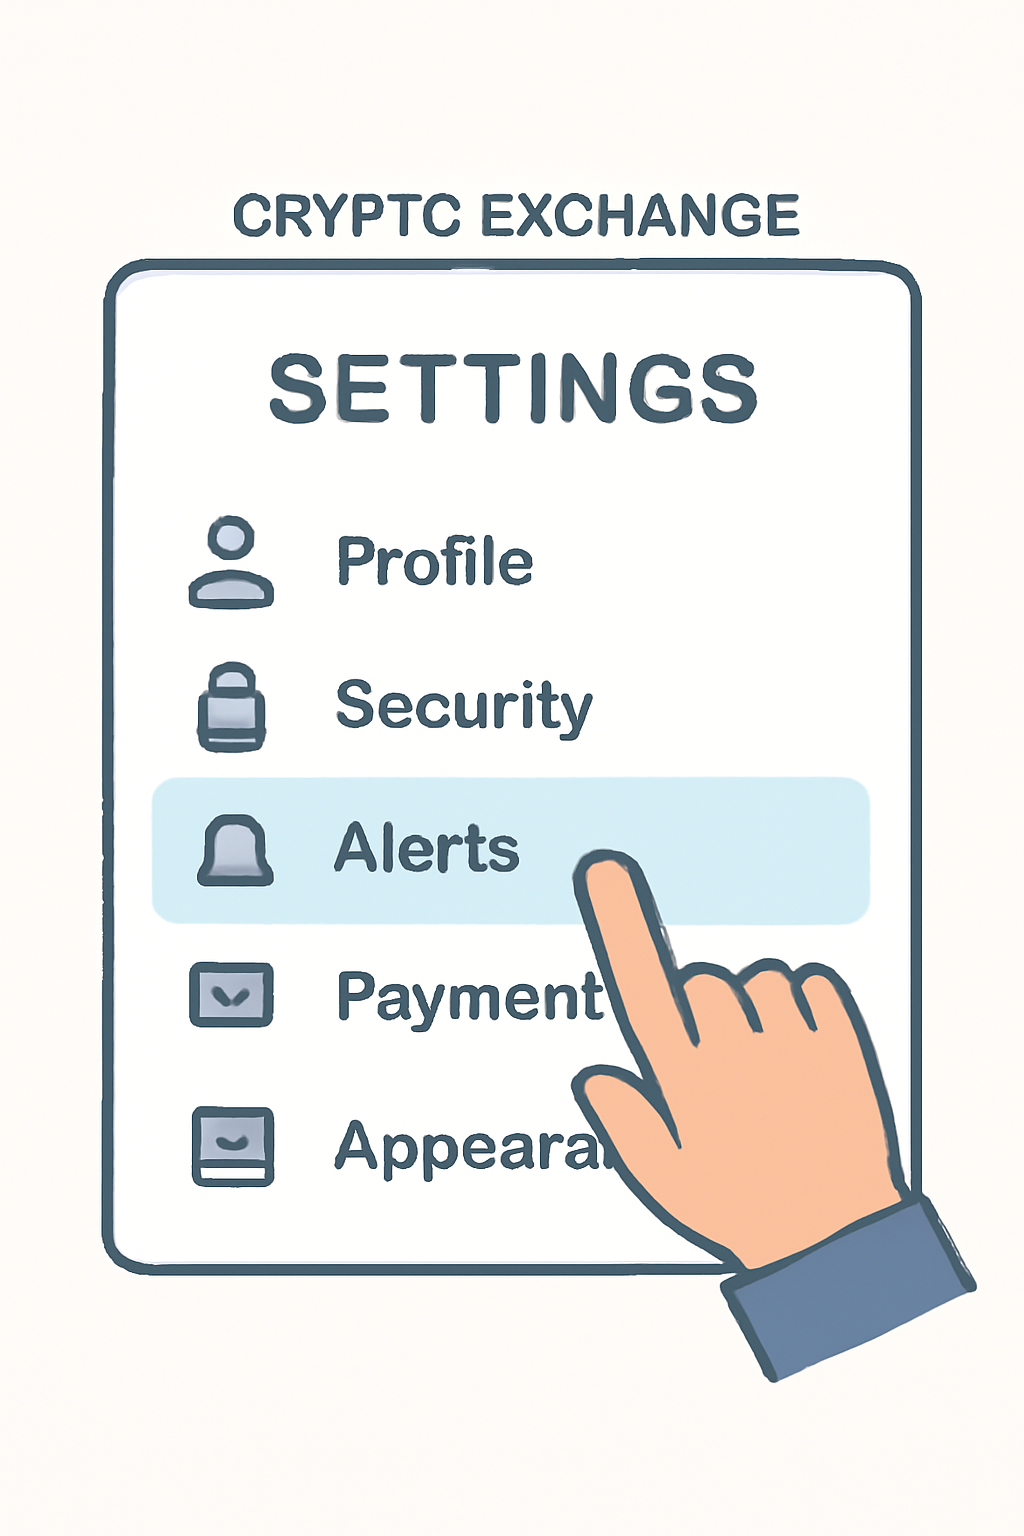
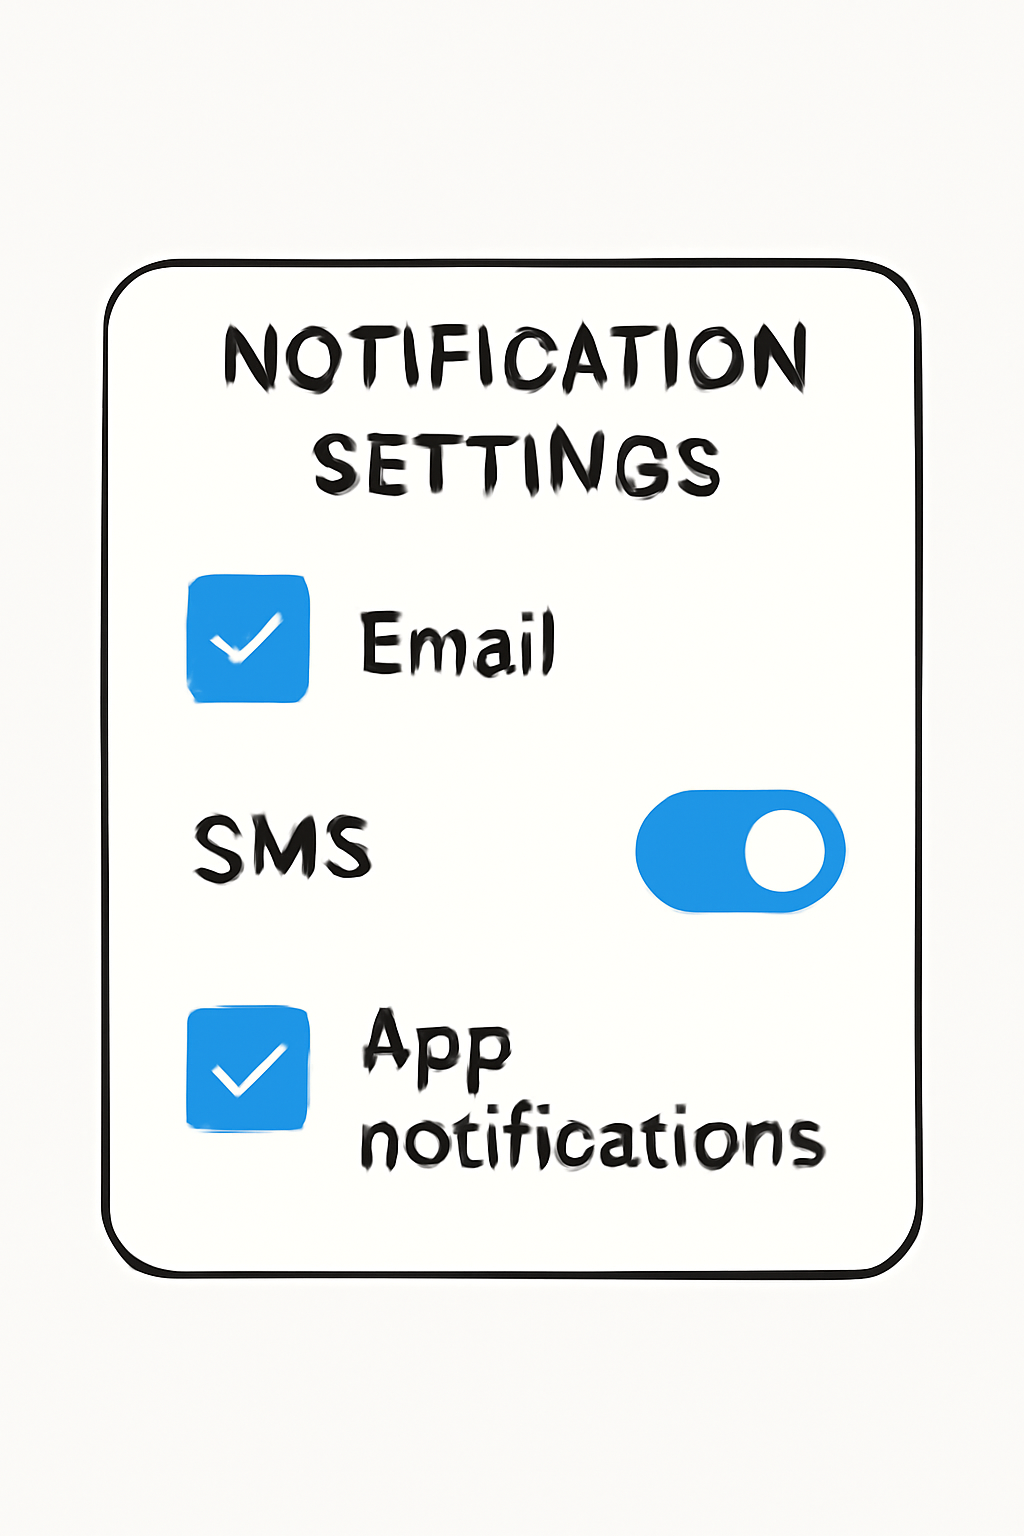
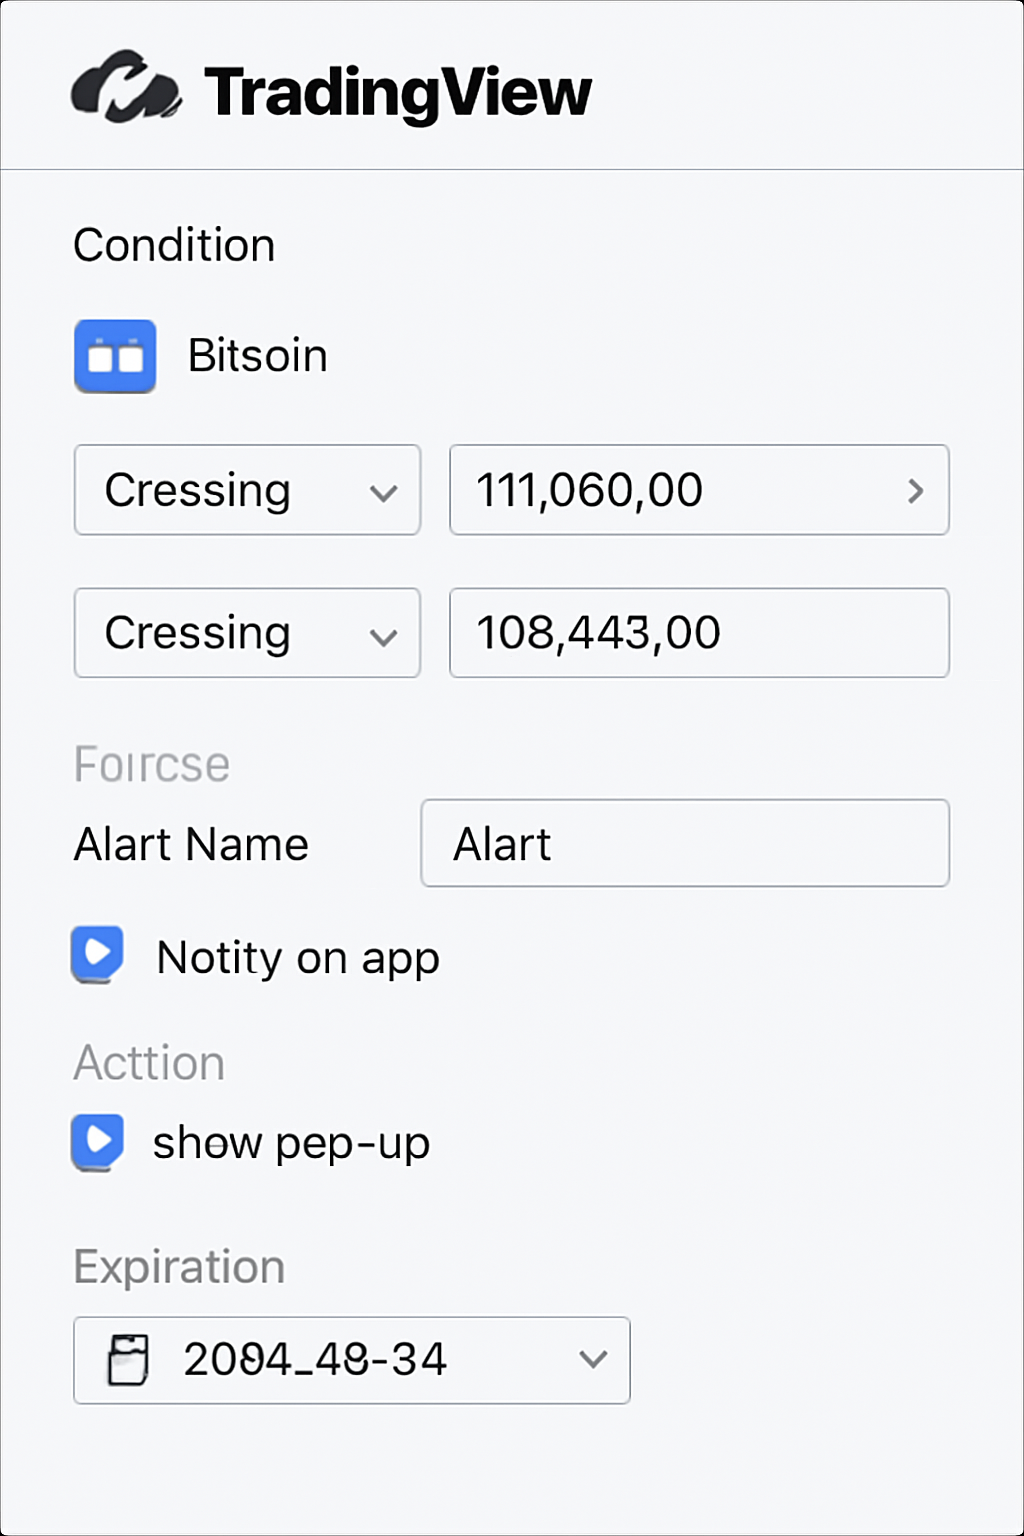
5. Set Up Custom Price Alerts: Never Miss a Trade Opportunity
No matter how diligent you are, you can’t monitor every tick by hand. Setting up custom price alerts through platforms like Binance or Coinbase ensures you receive instant notifications when your chosen crypto stocks hit specific targets or volatility thresholds. This lets you automate your response – whether that means entering a position on a breakout or closing out before a reversal.
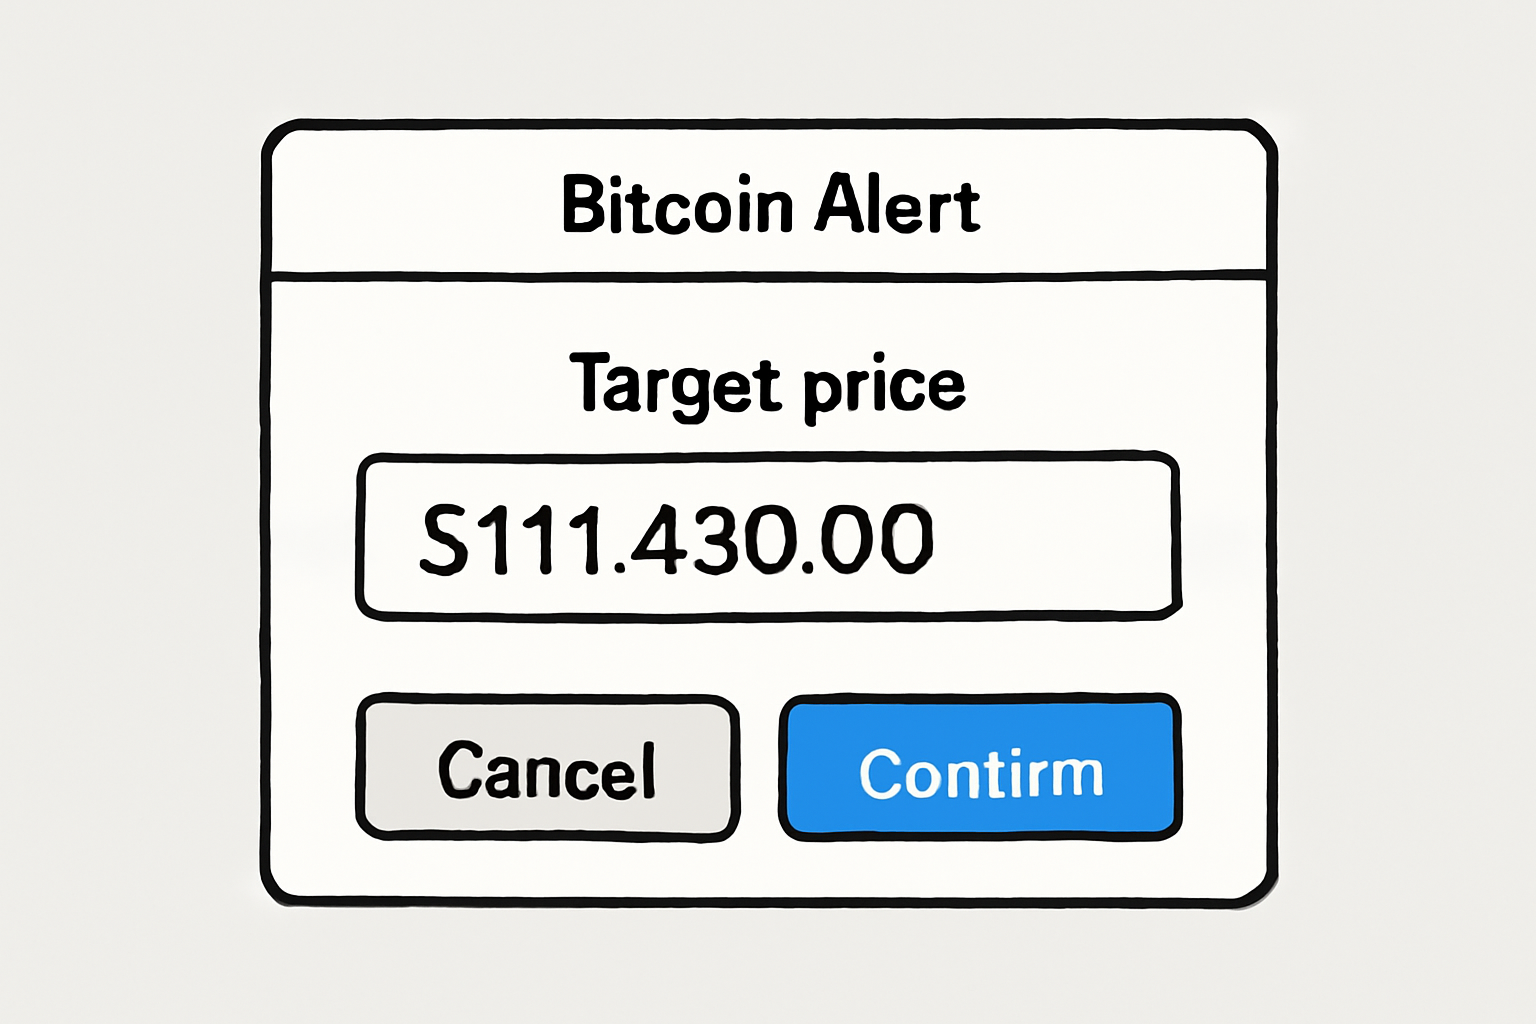
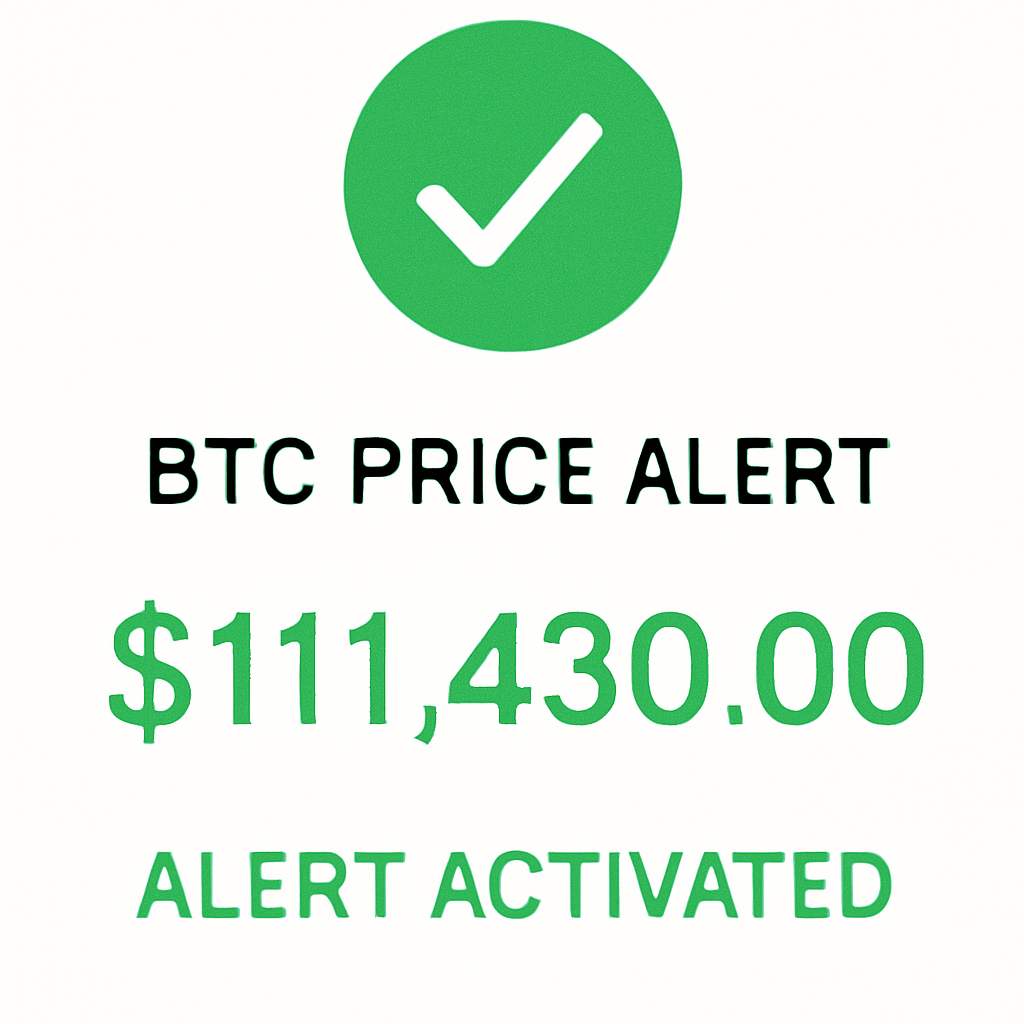
How to Set Custom BTC Price Alerts at $111,430 on Binance & Coinbase

The synergy between these platforms empowers traders with both broad market context and pinpoint precision – a combination that is essential in today’s fast-moving crypto landscape.
Bitcoin Maintains Position Above $111,000: What’s Next?
The current market environment – with Bitcoin holding firm at $111,430.00 – is a testament to the importance of real-time data in shaping day trading decisions. As volatility persists and new catalysts emerge daily, leveraging these tools is not just smart – it’s strategic.
Bitcoin (BTC) Price Prediction Table: 2026–2031
Short-Term to Mid-Term Price Outlook Based on Current Support/Resistance and Market Trends (as of October 2025)
| Year | Minimum Price (Bearish) | Average Price (Base Case) | Maximum Price (Bullish) | Year-over-Year Change (Avg) | Market Scenario Insights |
|---|---|---|---|---|---|
| 2026 | $95,000 | $125,000 | $155,000 | +12.2% | Potential post-halving rally; volatility as macro conditions shift |
| 2027 | $105,000 | $138,000 | $180,000 | +10.4% | Institutional adoption grows; regulatory clarity improves |
| 2028 | $120,000 | $152,000 | $210,000 | +10.1% | Global digital asset integration; possible new ATH amid tech upgrades |
| 2029 | $135,000 | $167,000 | $245,000 | +9.9% | Competition with CBDCs; scaling solutions mature |
| 2030 | $150,000 | $185,000 | $275,000 | +10.8% | Mainstream adoption; ETF/derivative growth; regulatory stability |
| 2031 | $165,000 | $205,000 | $310,000 | +10.8% | Potential for mass adoption or new disruptive competition |
Price Prediction Summary
Bitcoin is expected to maintain a bullish trajectory over the next six years, with the average price rising from $125,000 in 2026 to $205,000 by 2031. The minimum and maximum ranges reflect both bearish and bullish scenarios, accounting for potential market corrections, regulatory shifts, and adoption rates. Yearly average growth is projected around 10-12%, with higher volatility possible around major market events or global macro shifts.
Key Factors Affecting Bitcoin Price
- Halving cycles and supply constraints supporting price appreciation
- Increased institutional participation and ETF/derivative adoption
- Regulatory developments in key markets (US, EU, Asia)
- Technological improvements (scalability, Lightning Network, privacy)
- Global macroeconomic trends and fiat currency stability
- Competition from other digital assets and CBDCs
- Potential for unforeseen regulatory crackdowns or security incidents
Disclaimer: Cryptocurrency price predictions are speculative and based on current market analysis.
Actual prices may vary significantly due to market volatility, regulatory changes, and other factors.
Always do your own research before making investment decisions.
Staying ahead in the crypto stock market isn’t just about having access to data, it’s about knowing how to act on it with confidence and speed. The right suite of tools can transform a reactive trader into a proactive strategist, especially when every tick can mean the difference between profit and loss.
Integrating Your Toolkit: A Strategic Approach
To truly capitalize on real-time crypto stock prices, integrate these platforms into a single workflow. Start with CoinMarketCap for your macro view, use its API or web platform to scan for volume surges and identify trending coins. Next, pivot to TradingView for in-depth charting; set up custom layouts that overlay key technical indicators on assets like Bitcoin, which is currently trading at $111,430.00. For immediate market context and news-driven volatility, keep the Investing. com Crypto Dashboard open in a separate browser tab or mobile app so you can react quickly to headline-driven moves.
If your focus is short-term BTC trading, let Bitbo be your go-to for granular price action and real-time on-chain signals. This level of detail often reveals subtle shifts that precede larger moves, giving you an edge over traders who rely solely on price charts.
Automate Your Edge: The Power of Custom Alerts
The final piece is automation. By setting up custom price alerts through Binance or Coinbase, you remove emotion from the equation and ensure you’re notified the moment Bitcoin crosses critical thresholds, like its recent high of $111,680.00 or support at $108,848.00. This hands-free approach is invaluable during periods of rapid movement when manual monitoring becomes impractical.
Building Discipline: Best Practices for Day Traders
No tool can replace discipline and risk management. Even with real-time insights from CoinMarketCap or precision charting via TradingView, always:
- Set clear profit targets and stop-losses: Let alerts trigger your decisions but stick to your plan.
- Avoid overtrading: Not every signal warrants action; patience pays off in volatile markets.
- Review your trades: Use historical data from these platforms to analyze what worked, and what didn’t.
- Diversify your sources: Cross-reference data between CoinMarketCap, Investing. com, and Bitbo for confirmation before making big moves.
Staying Agile as Market Conditions Shift
The crypto landscape evolves rapidly, tools that work today may need re-evaluation tomorrow as new features roll out or market structure changes. Stay connected with communities on TradingView or Twitter/X to learn about emerging strategies and updates from these platforms.
If you’re looking to refine your approach further or want hands-on guidance in setting up these systems for real-world trading scenarios, explore our deeper dive at /how-to-use-real-time-crypto-stock-data-for-day-trading-success.
Combine CoinMarketCap Data with TradingView Alerts for Seamless Day Trading
The bottom line? Effective day trading isn’t just about watching prices, it’s about building an ecosystem where information flows seamlessly into action. With Bitcoin holding steady above $111,000 and volatility showing no signs of slowing down, now is the time to sharpen your edge with the right tools, and the discipline to use them strategically.