
Day trading crypto stocks in today's volatile market demands more than intuition - it requires a strategic edge built on real-time data, rapid analysis, and disciplined execution. As of September 22,2025, the crypto landscape is as dynamic as ever, with price swings creating both lucrative opportunities and significant risks for traders who are prepared to act quickly. Leveraging real-time crypto stock data has become essential for anyone serious about day trading success.
Leverage Real-Time Market Data APIs for Second-by-Second Price Tracking
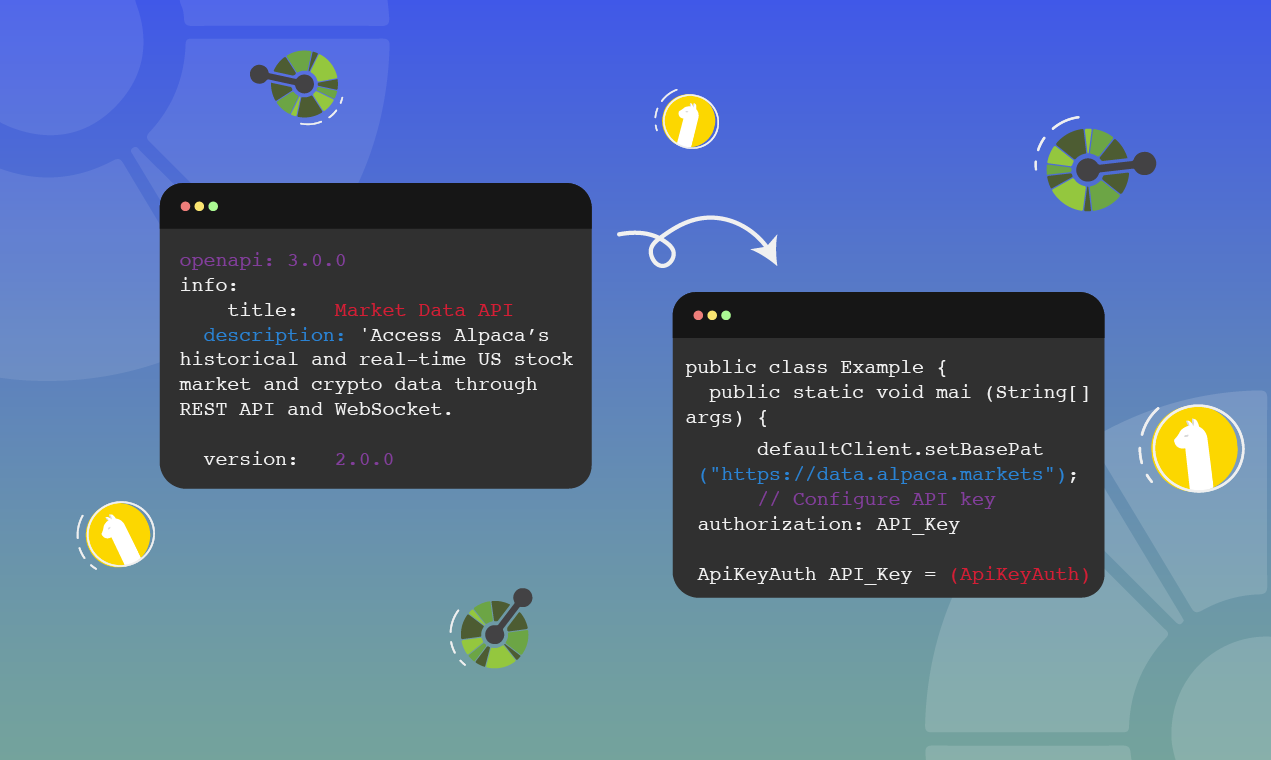
The foundation of any effective day trading strategy is access to reliable, up-to-the-second market data. Platforms like Alpaca offer robust real-time Market Data APIs, providing second-level granularity and true event-based streaming via Websockets. This means you can track every tick in price as it happens - a critical advantage when milliseconds can define your profits or losses. For example, if Bitcoin is currently trading at $105,171, an API-driven alert system can instantly notify you of sudden movements above or below this threshold, allowing for swift trade execution.
Utilize TradingView’s Charting Tools and Integrate ChatGPT for Instant Trading Signals
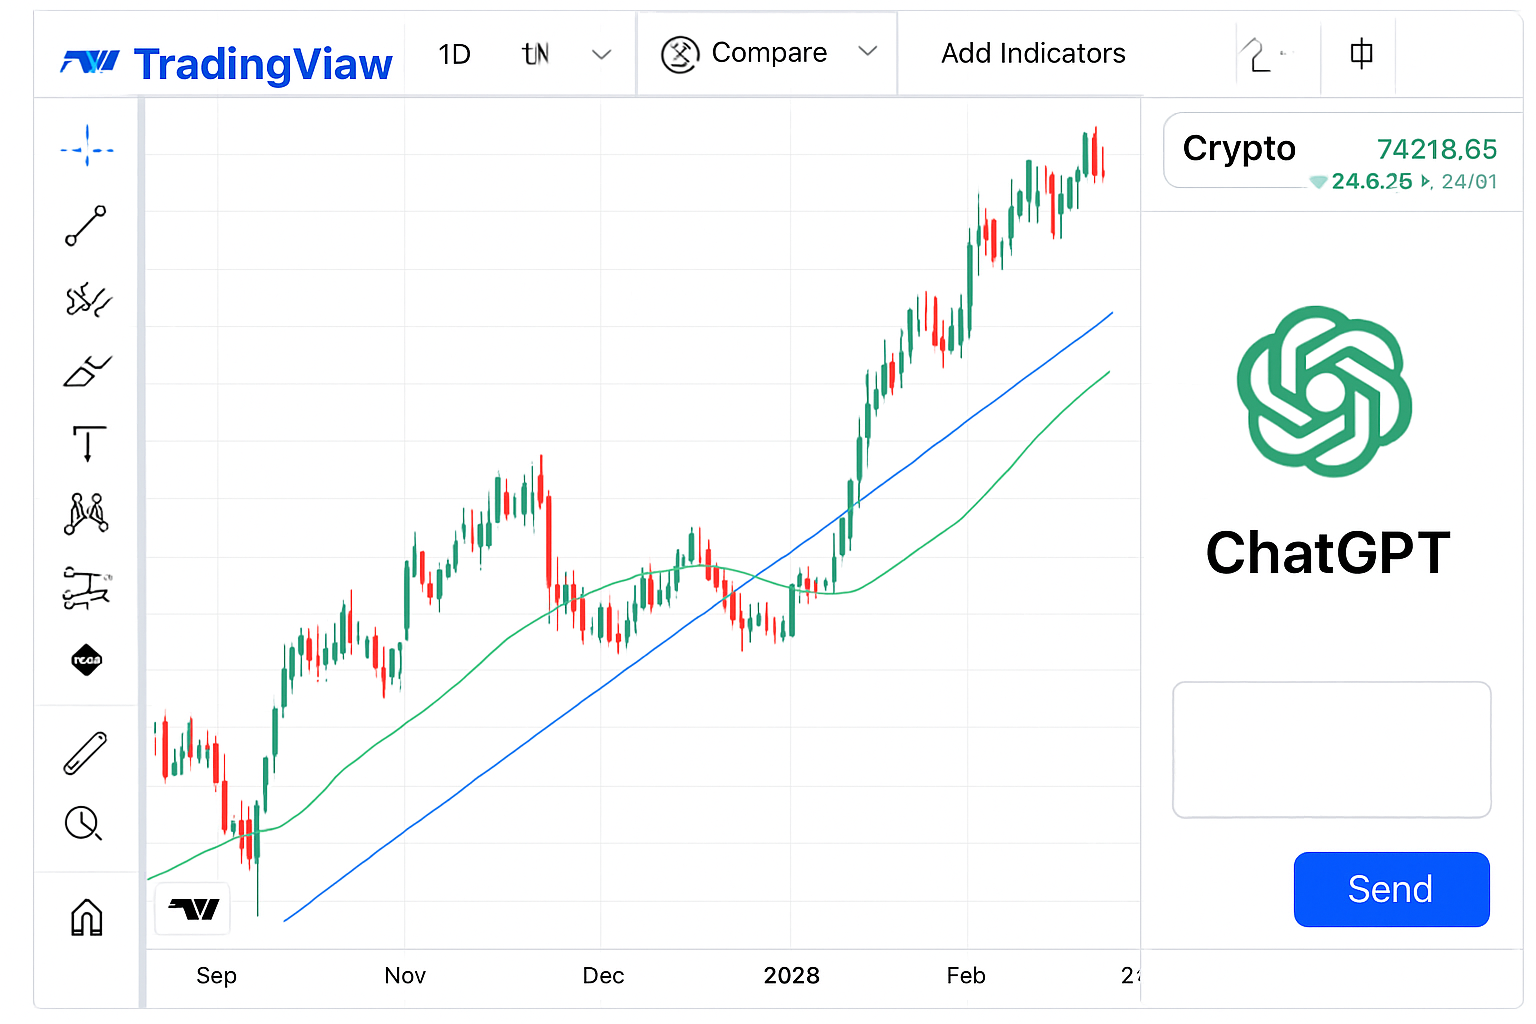
No successful day trader operates without powerful charting tools. TradingView offers some of the most advanced interactive charts available, supporting custom indicators and overlays that help visualize price action in real time. By integrating ChatGPT directly into your TradingView workflow, you can generate instant trading signals based on live market conditions and your preferred indicators. This AI-driven approach streamlines decision-making by synthesizing complex data into actionable insights right when you need them most.
Adopt Short Time Frame Chart Analysis to Capture Rapid Price Movements
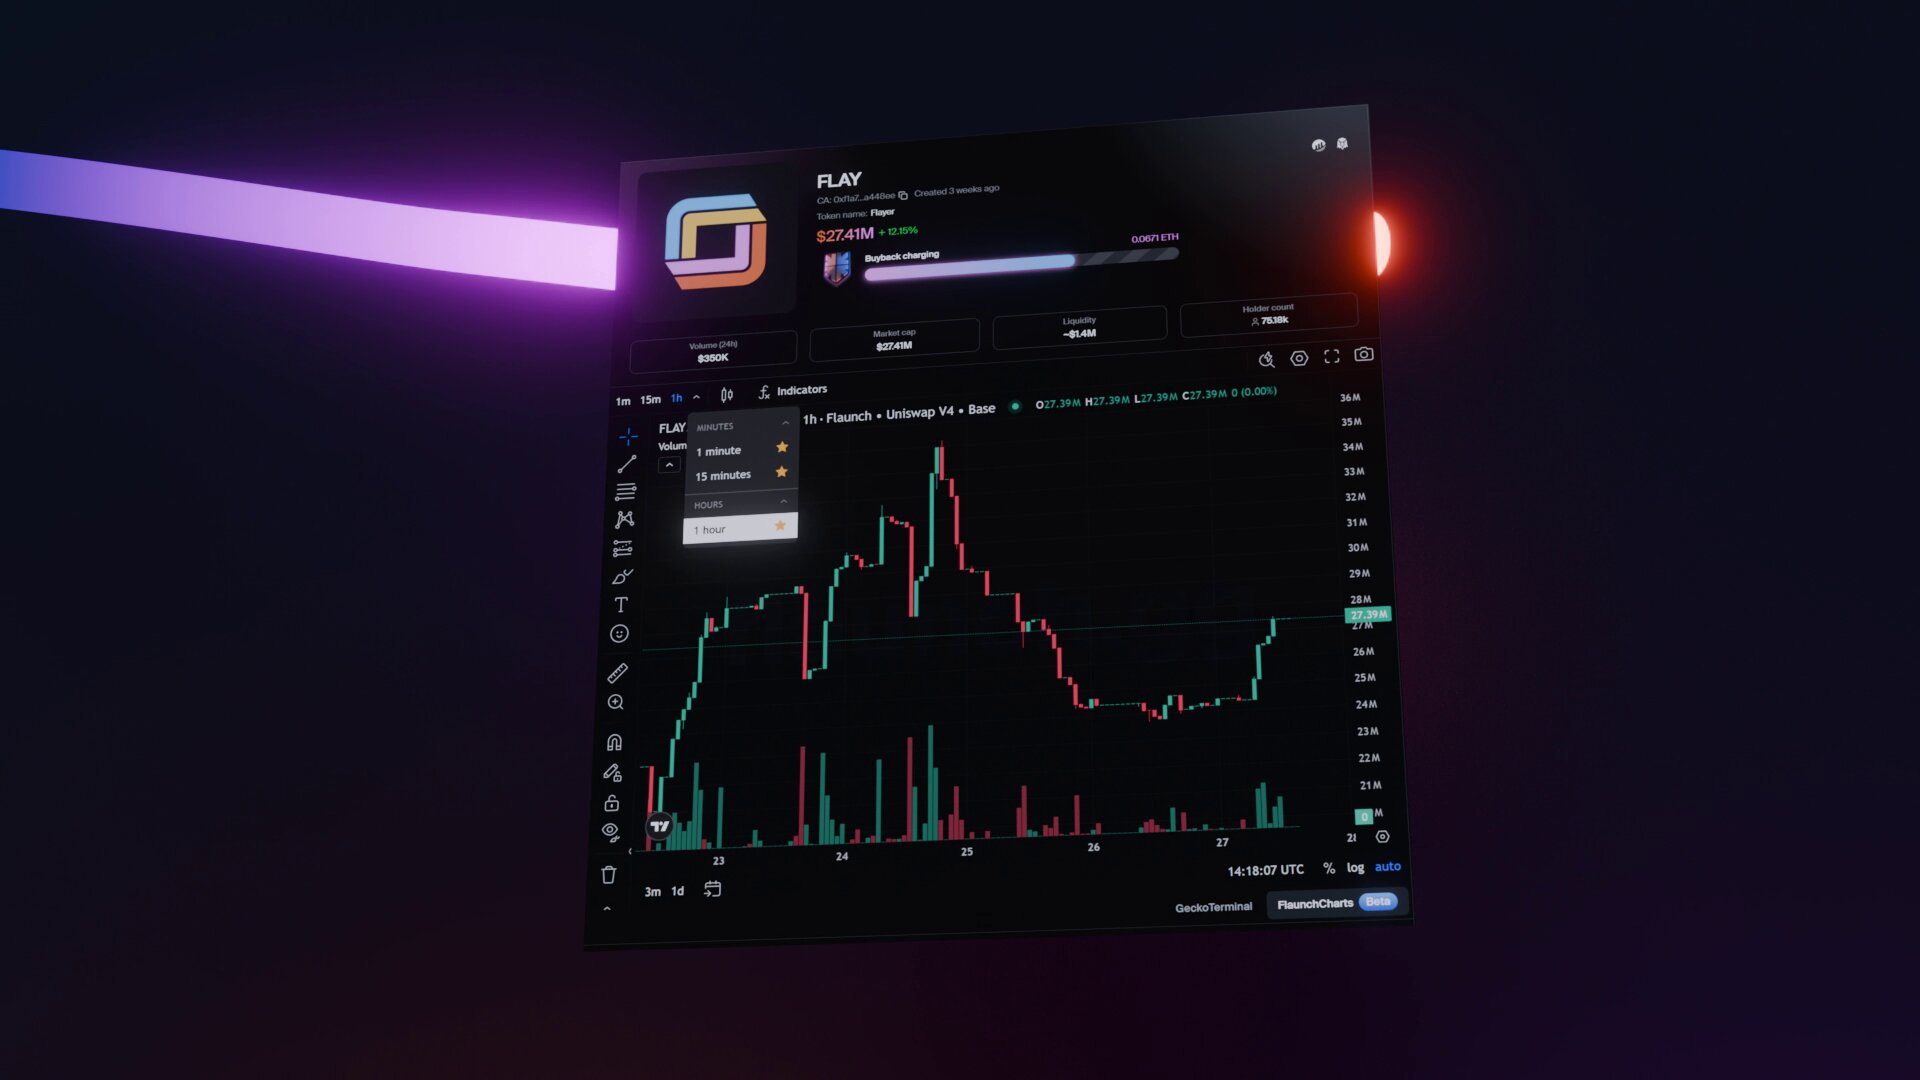
Catching profitable trades in the fast-moving crypto market means analyzing short time frames. Popular intervals among day traders include 15-minute and 1-hour charts - each revealing patterns that longer-term charts may obscure. These compressed views help you identify micro-trends, volatility spikes, and breakout setups with greater precision. For instance, if Ethereum experiences a sharp move within a 15-minute window while holding above its current support level, this could signal an imminent opportunity to enter or exit a position.
Top Short Time Frames & Pro Tips for Spotting Breakouts
- Adopt Short Time Frame Chart Analysis (15-Minute, 1-Hour): Using 15-minute and 1-hour charts allows traders to spot rapid price movements and potential breakout opportunities as they unfold in real time. These intervals are ideal for identifying short-term trends and reacting swiftly to market volatility.
- Leverage Real-Time Market Data APIs like Alpaca for Second-by-Second Price Tracking: Platforms such as Alpaca provide true event-based streaming data via Websockets, delivering second-by-second updates crucial for timely trade decisions on short time frames.
- Utilize TradingView's Charting Tools and Integrate ChatGPT for Instant Trading Signals: TradingView offers advanced charting with customizable time frames, while integrating ChatGPT can help interpret signals and automate responses for breakouts on 15-min or 1-hour intervals.
- Set Automated Alerts and Websocket-Based Event Triggers for Volatility Breakouts: Configure real-time alerts and event-based triggers using Websockets to instantly notify you of significant price moves or volume spikes, ensuring you never miss a breakout on your chosen time frame.

- Combine Multiple Technical Indicators (e.g., RSI, MACD, EMA) to Confirm Entry and Exit Points: Use a blend of indicators on short time frames to validate breakout signals and reduce false positives. For example, combine RSI, MACD, and EMA overlays for more reliable trade confirmations.
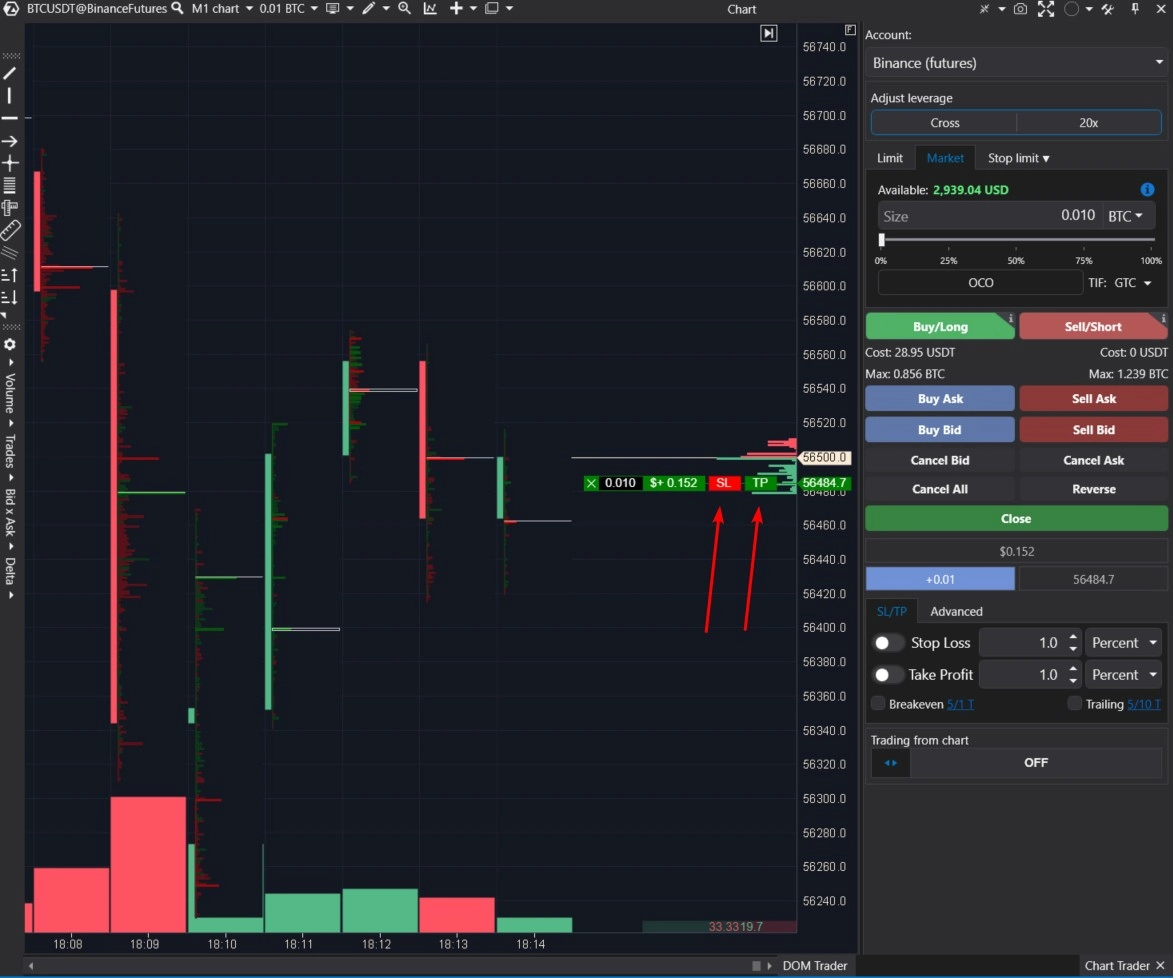
- Practice Strict Risk Management: Set Stop-Loss and Take-Profit Orders Based on Live Data: Always define your risk parameters with stop-loss and take-profit orders, adjusting them in real time as new data emerges on your preferred short intervals.
Set Automated Alerts and Websocket-Based Event Triggers for Volatility Breakouts
The difference between catching a breakout or missing it often comes down to automation. Setting up automated alerts using websocket-based event triggers ensures you're notified the instant key thresholds are breached - whether that's Bitcoin surging past $105,171 or another asset breaking its resistance level. These tools allow you to react immediately without being glued to your screen all day.
This approach not only improves your reaction speed but also reduces emotional decision-making by enforcing predefined criteria for entering or exiting trades.
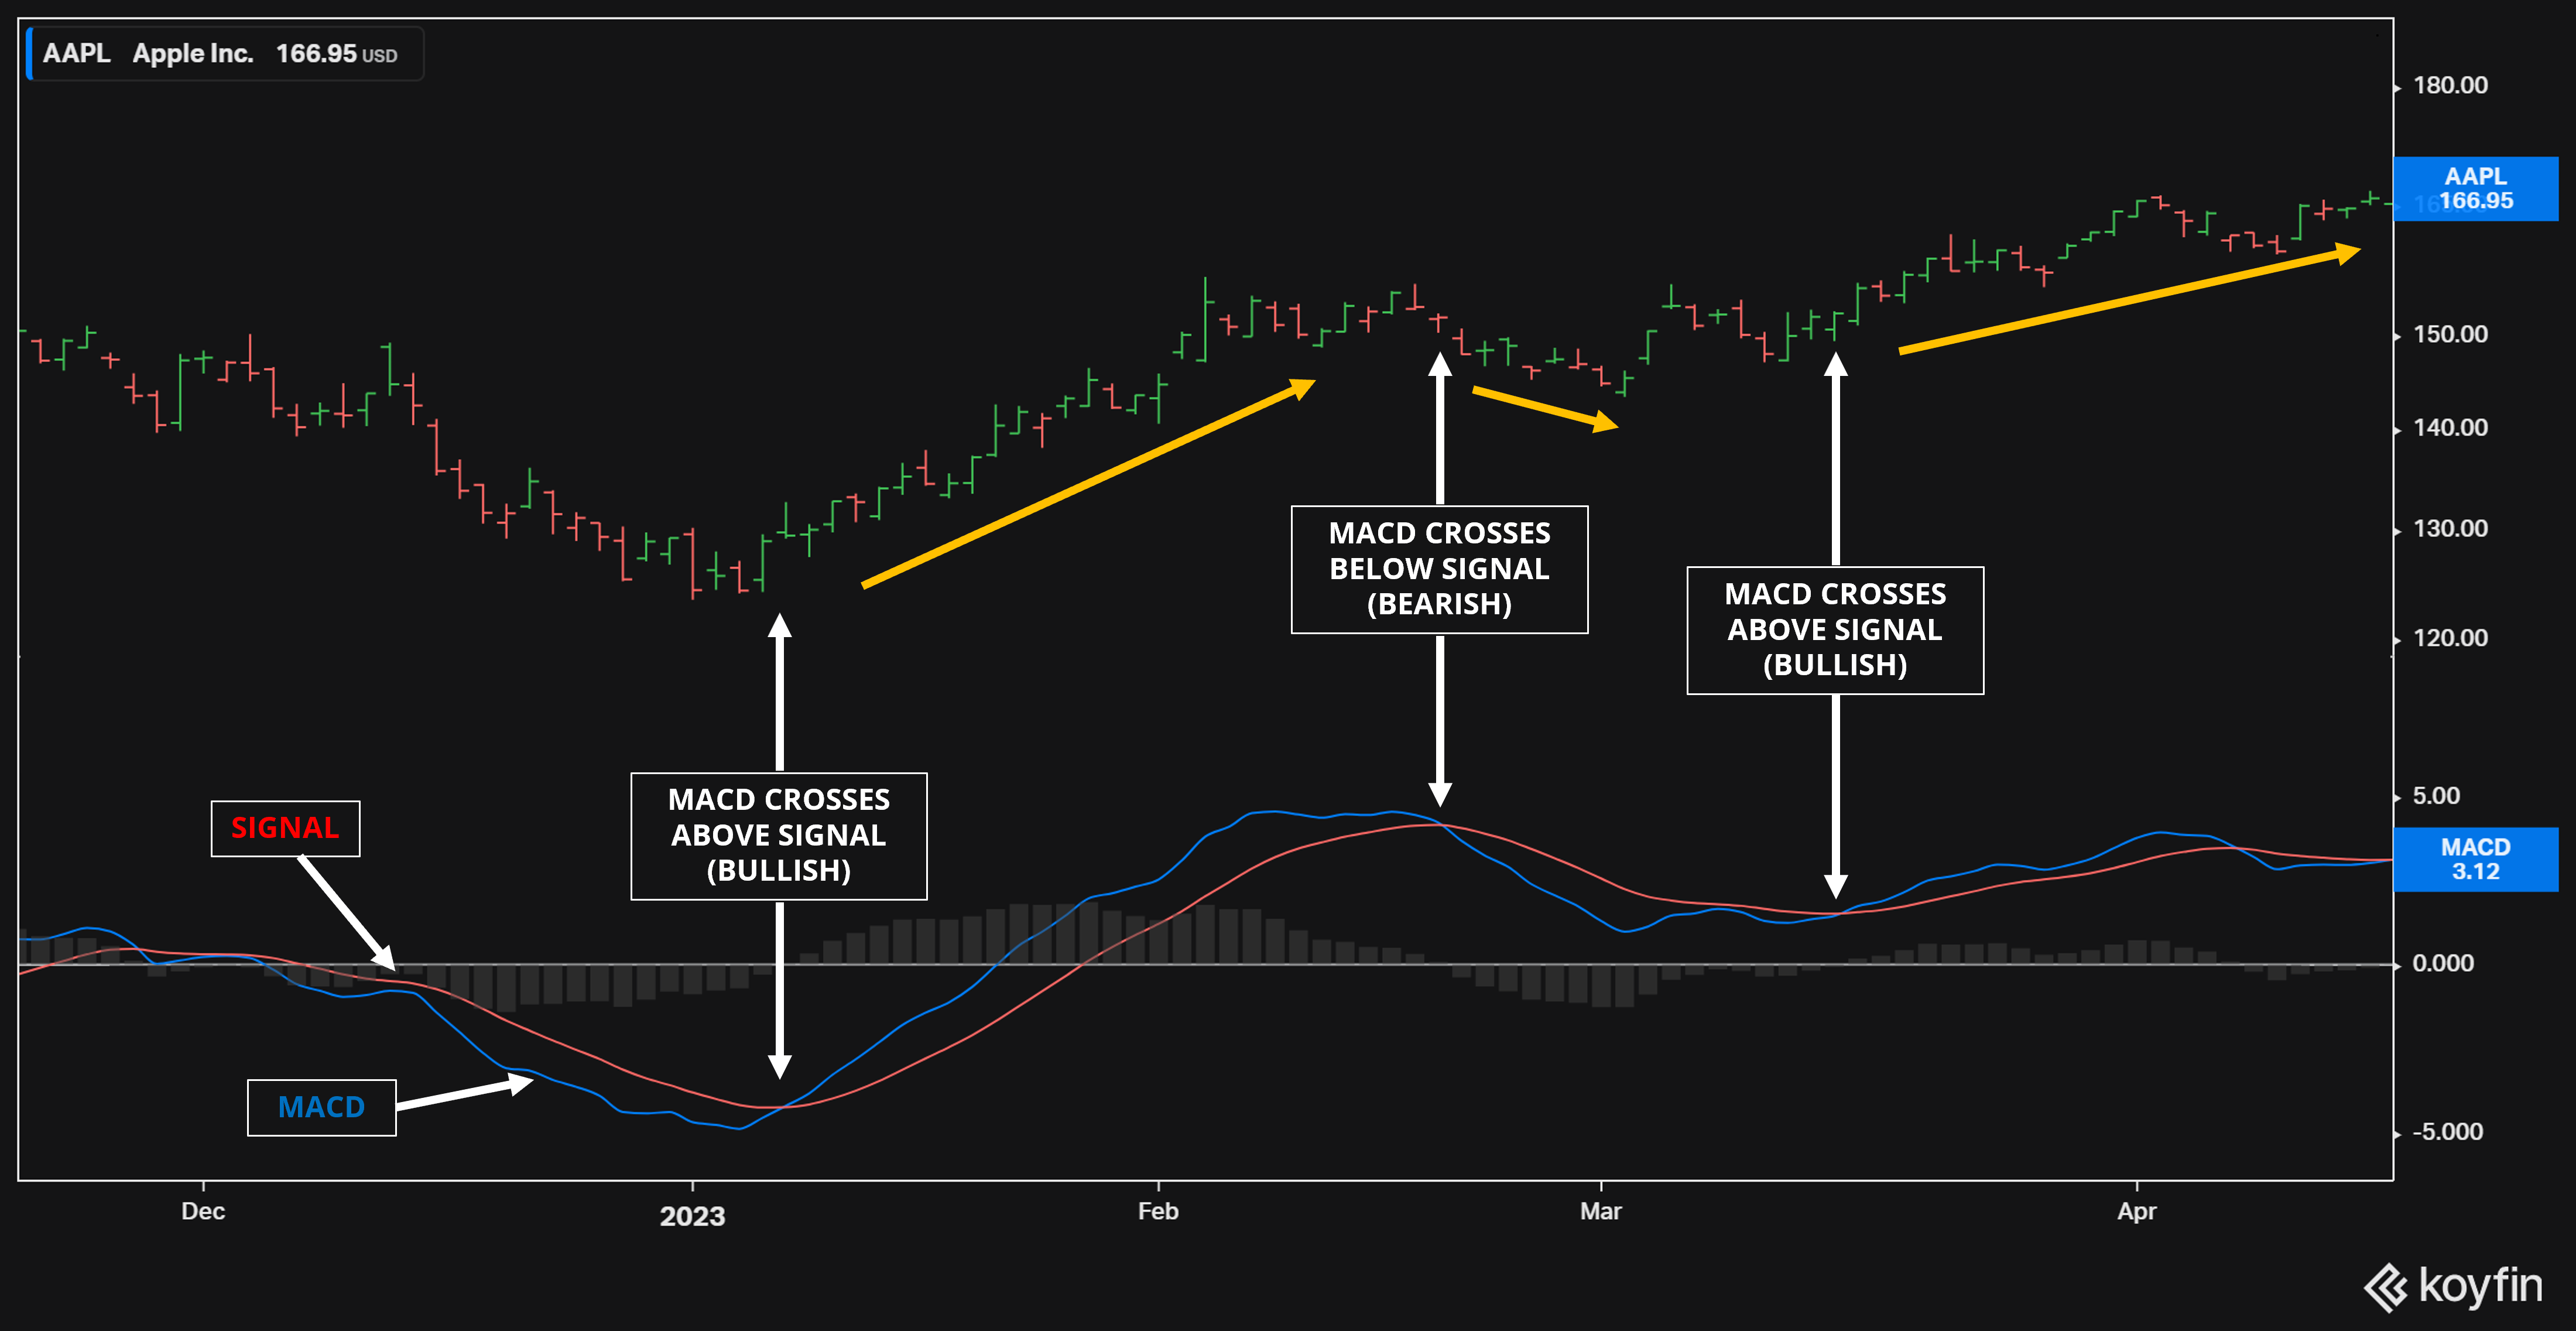
Combine Multiple Technical Indicators to Confirm Entry and Exit Points
While real-time data and instant alerts are powerful, their effectiveness multiplies when paired with a disciplined approach to technical analysis. Combining multiple indicators, such as the Relative Strength Index (RSI), Moving Average Convergence Divergence (MACD), and Exponential Moving Average (EMA): can help validate your trading signals and filter out market noise. For instance, an upward crossover on the MACD, combined with an RSI reading below 70 and price action above the EMA on a 15-minute chart, provides a higher probability setup than relying on a single indicator alone. This multi-layered confirmation process is crucial in today’s unpredictable climate, where false breakouts are common.
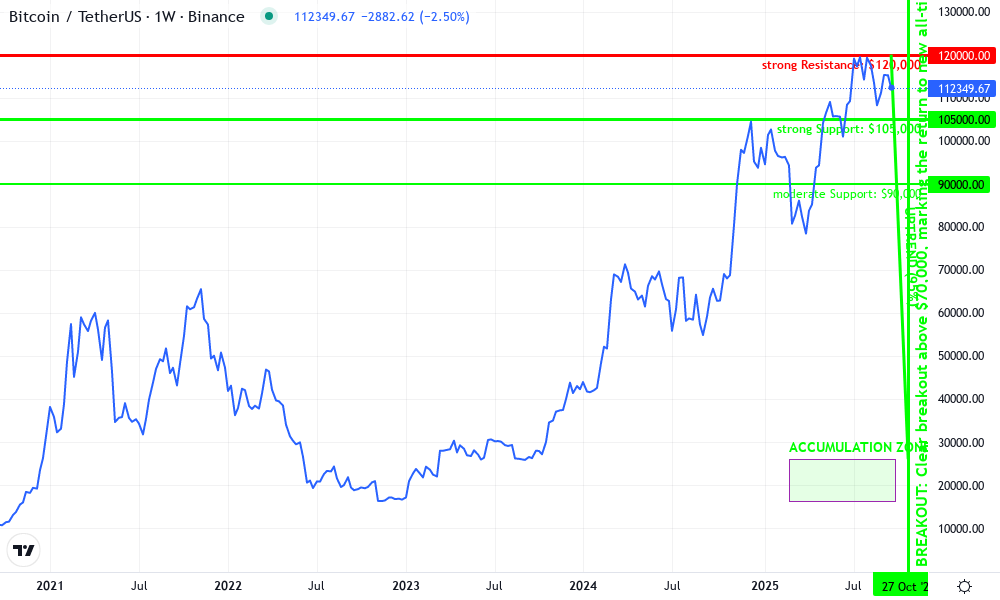
Bitcoin Technical Analysis Chart
Analysis by Jessica Navarro | Symbol: BINANCE:BTCUSDT | Interval: 1W | Drawings: 6
Technical Analysis Summary
Start with a main uptrend line from late 2023 at around $26,000 to the September 2025 high near $120,000, using the trend_line tool. Draw horizontal lines at current support ($105,000), intermediate resistance ($120,000), and major resistance (recent all-time high just above $120,000) using the horizontal_line tool. Indicate the accumulation zone from late 2022 to early 2023 with a rectangle. Mark the breakout above $70,000 in early 2024 with a vertical_line and arrow_marker. Use the long_position tool for conservative entry near $105,000 and text/callout to note 'Cautious accumulation zone' and 'Potential profit-taking zone' near $120,000.
Risk Assessment: medium
Analysis: While the long-term trend remains bullish, the chart shows signs of exhaustion near the $120,000 area, and volatility is high after a parabolic move. Conservative investors should guard against potential sharp corrections.
Jessica Navarro's Recommendation: Reduce exposure as price approaches $120,000, only add near confirmed support ($105,000), and prioritize capital preservation. Maintain a long-term outlook but act with clarity and caution at these levels.
Key Support & Resistance Levels
📈 Support Levels:
- $105,000 - Most recent multi-touch support level after the latest run-up, tested twice in 2025. strong
- $90,000 - Psychological and structural support from the prior 2025 consolidation zone. moderate
📉 Resistance Levels:
- $120,000 - Current all-time high and clear resistance zone; price has failed to break higher several times. strong
Trading Zones (low risk tolerance)
🎯 Entry Zones:
- $105,000 - Conservative re-entry point on pullbacks to strong support; aligns with portfolio risk management. low risk
🚪 Exit Zones:
- $120,000 - Profit target at current resistance; prudent for partial de-risking. 💰 profit target
- $99,000 - Stop-loss below next structural support to preserve capital. 🛡️ stop loss
Technical Indicators Analysis
📊 Volume Analysis:
Pattern: N/A (not shown on this chart), but typically, volume surges on breakouts and consolidations are key for validation.
Monitor volume for confirmation of trend continuation or reversal, especially at $105,000 and $120,000.
📈 MACD Analysis:
Signal: N/A (not visible), but after such a strong move, watch for MACD cross-downs as early warning.
MACD cross-downs near highs should be seen as caution signals for aggressive profit-taking.
Applied TradingView Drawing Utilities
This chart analysis utilizes the following professional drawing tools:
Disclaimer: This technical analysis by Jessica Navarro is for educational purposes only and should not be considered as financial advice. Trading involves risk, and you should always do your own research before making investment decisions. Past performance does not guarantee future results. The analysis reflects the author's personal methodology and risk tolerance (low).
Practice Strict Risk Management Using Live Data
Even the best strategies can unravel without rigorous risk management. Utilizing live data feeds enables you to set precise stop-loss and take-profit orders that adapt to current market conditions. For example, if Bitcoin is trading at $105,171, you might place a stop-loss just below a key support level or set incremental take-profits as price approaches resistance zones identified in real time. This reduces exposure to sudden reversals, a constant threat in crypto day trading.
Remember: discipline trumps bravado. Never risk more than you’re prepared to lose on any single trade, and always use position sizing based on your total portfolio value rather than gut feeling. With automated order placement tied directly to live data streams, you can protect gains while minimizing losses, turning volatility into opportunity rather than peril.
Expert Tips for Real-Time Crypto Stock Day Trading
- Stay nimble: The market rewards speed and flexibility. Don’t get anchored to outdated price levels or stubborn biases.
- Backtest your setups: Use historical replay features in charting tools to validate strategies before risking capital.
- Monitor liquidity: Thin order books increase slippage risk, always check volume on your chosen timeframe before executing trades.
- Keep learning: The landscape evolves rapidly; stay connected with communities sharing the latest tools and tactics.
Which real-time tool or strategy has most improved your day trading success?
With today's volatile crypto markets, real-time data and smart strategies are more important than ever. Which of these has made the biggest difference in your day trading results?
The integration of real-time Market Data APIs, advanced charting platforms like TradingView with ChatGPT signal support, short-term interval analysis, automated event triggers, multi-indicator validation, and strict risk management forms a resilient framework for day trading crypto stocks successfully in 2025’s high-stakes environment. By committing to these practices, and continually adapting as new technologies emerge, you’ll be well positioned not just to survive but thrive amid crypto’s relentless volatility.


No comments yet. Be the first to share your thoughts!