
MARA Holdings stock sits at $11.18 right now, down 3.95% or -$0.46 in the last 24 hours, with a high of $11.74 and low of $11.085. Volatility like this screams opportunity for aggressive traders who know where to look. Bitcoin’s network hashrate just dipped to 970.63 EH/s after hovering near 995 EH/s, and a 2.43% difficulty drop means miners like MARA are primed for higher rewards. MARA’s running a beastly 61.7 EH/s while holding 38,689 BTC. Track these hashrate metrics against the network total, and you’ve got your edge for trading MARA stock in 2026.

Hashrate Dominance: MARA’s Power Play in Bitcoin Mining
Hashrate isn’t just a buzzword; it’s your precision scalpel for MARA trades. MARA’s 61.7 EH/s gives it a solid slice of the network pie, especially as total hashrate fluctuates. When network difficulty fell from 138.97T to 135.59T, MARA’s output per rig spiked. This directly juices revenue, turning Bitcoin price swings into stock catalysts. I’ve seen days where a 1% hashrate edge over competitors flips MARA from laggard to leader. Right now, at $11.18, with P/E at 5.18 and EPS $2.16, undervaluation stares you in the face if Bitcoin stabilizes above recent levels.
Picture this: MARA’s share of global hashrate climbs during dips like April’s adjustment. Miners with efficient ops, like MARA’s fleet, mine more BTC per energy dollar. Tie this to stock moves, and you spot entries. Network at 970 EH/s? MARA’s relative strength surges. That’s your trading MARA with hashrate metrics playbook. Speed in: buy the dip when MARA’s hashrate reports beat expectations. Precision out: sell on overbought signals post-halving echoes.
MARA’s Twin-Turbo Shift: From Pure HODL to Flexible Firepower
Marathon flipped the script in 2026. Their “twin-turbo” strategy blends massive mining scale with targeted BTC buys, ballooning treasury to 38,689 coins. But the bombshell? Revised policy opens the door to selling stockpiled Bitcoin. No more rigid HODL; now it’s adaptive cash flow. That sparked an 8.4% high-volume sell-off on March 3, dropping shares amid fears of dilution. Yet, analysts see upside: targets hit $23 on rallies, with bull cases to $30-$40 if debt stays managed.
This pivot’s a double-edged sword. HODLing amplified gains during Bitcoin surges, like the 22% MARA pop when BTC rallied. But volatility wrecked book value. Selling flexibility lets MARA fund expansion without dilution, targeting 60 and EH/s growth. For traders, watch treasury reports like hawks. A BTC sale at peaks funds hashrate builds, igniting multi-month runs. At $11.18, post-sell-off, this sets up a rebound if network difficulty keeps easing.
Marathon Digital Holdings Technical Analysis Chart
Analysis by Tyler Fenwick | Symbol: NASDAQ:MARA | Interval: 1h | Drawings: 9
Technical Analysis Summary
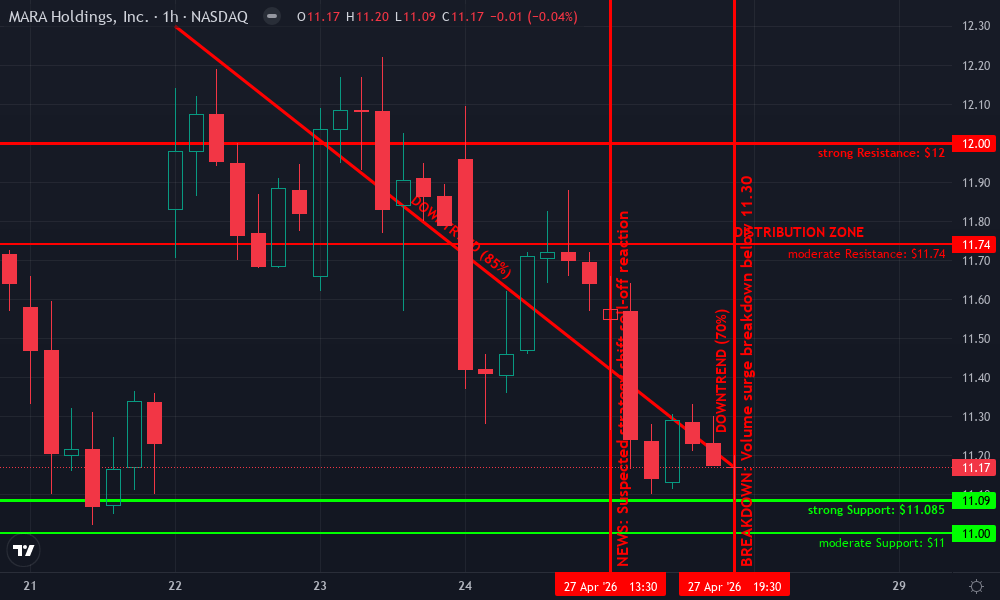
Aggressively mark the dominant downtrend with a thick red trend_line connecting the swing high on April 22 at ~12.30 to the current rejection zone near 11.17 on April 29. Overlay horizontal_lines at key support 11.085 (strong, green) and resistance 11.74/12.00 (red). Use short_position markers at 11.20 entry with arrow_mark_down. Fib_retracement from recent high 11.74 to low 11.085 for pullback targets. Rectangle the tight consolidation between 11.10-11.50 last few hours. Callouts on MACD bearish divergence and volume spike on dump. Vertical_line on potential news dump around April 27. Text ‘SHORT SETUP – High Risk Scalp’ at current price.
Risk Assessment: high
Analysis: Volatile crypto-linked stock in downtrend amid BTC hashrate flux and strategy news; tight stops needed for scalps
Tyler Fenwick’s Recommendation: Aggressive short now at 11.20, target 10.80, high risk tolerance play – speed kills in day trading!
Key Support & Resistance Levels
📈 Support Levels:
-
$11.085 – Intraday low with volume cluster, potential bounce or breakdown
strong -
$11 – Psychological round number, prior session low
moderate
📉 Resistance Levels:
-
$11.74 – Recent intraday high rejection
moderate -
$12 – Multi-candle resistance zone from 27-28
strong
Trading Zones (high risk tolerance)
🎯 Entry Zones:
-
$11.2 – Break below consolidation midpoint, aggressive short entry on momentum
high risk -
$11.5 – Fade any weak bounce to resistance for short reload
medium risk
🚪 Exit Zones:
-
$10.8 – Measured move extension from range, profit target
💰 profit target -
$11 – Support breakdown confirmation
💰 profit target -
$11.85 – Tight stop above recent high
🛡️ stop loss
Technical Indicators Analysis
📊 Volume Analysis:
Pattern: spike on downside candles, drying up on bounces
High volume confirming bearish moves, low on upticks = weak hands out
📈 MACD Analysis:
Signal: bearish crossover with histogram expansion
Momentum fully flipped south, divergence at highs
Applied TradingView Drawing Utilities
This chart analysis utilizes the following professional drawing tools:
Disclaimer: This technical analysis by Tyler Fenwick is for educational purposes only and should not be considered as financial advice.
Trading involves risk, and you should always do your own research before making investment decisions.
Past performance does not guarantee future results. The analysis reflects the author’s personal methodology and risk tolerance (high).
Bitcoin Network Dips Fuel MARA’s 2026 Trading Edges
Marathon Digital Technical Analysis Chart
Analysis by Tyler Fenwick | Symbol: NASDAQ:MARA | Interval: 1h | Drawings: 7
Technical Analysis Summary
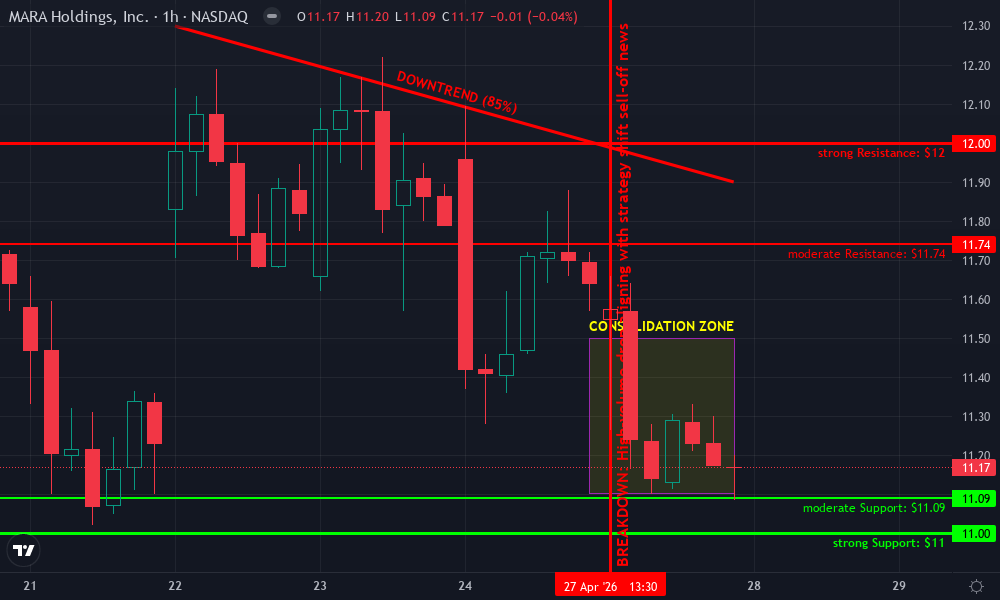
Aggressively mark the dominant downtrend line connecting the swing high on April 22, 2026 at ~$12.30 to the recent swing high on April 28 at ~$11.90, extending it forward for potential short entries. Draw horizontal support at $11.00 (strong, multiple tests) and $11.09 (intraday low), resistance at $11.74 (24h high) and $12.00 (prior consolidation). Use fib retracement from recent low $11.00 to high $12.30 for pullback targets. Rectangle the consolidation zone April 27-29 between $11.00-$11.50. Arrow down on MACD bearish divergence, callout declining volume on bounce. Vertical line on April 27 drop tied to strategy shift news. Long position only on breakout above $11.74 with stop below $11.00, but prefer shorts targeting $10.80.
Risk Assessment: high
Analysis: High vol stock tied to BTC, news catalysts like BTC sales pivot amplify swings; downtrend + weak volume = volatile shorts
Tyler Fenwick’s Recommendation: Aggressive short bias, scale in on $11.20 fails, trail stops—high reward if BTC dumps, but cut fast on reversal.
Key Support & Resistance Levels
📈 Support Levels:
-
$11 – Multi-test base, aligns with prior lows and psychological level
strong
-
$11.09 – 24h low, quick bounce zone
moderate
📉 Resistance Levels:
-
$11.74 – 24h high, rejection wick
moderate
-
$12 – Prior consolidation ceiling, volume shelf
strong
Trading Zones (high risk tolerance)
🎯 Entry Zones:
-
$11.2 – Short entry on rejection at minor resistance in downtrend, aggressive scalp
high risk
-
$11 – Long dip-buy only on volume spike breakout confirmation
high risk
🚪 Exit Zones:
-
$10.8 – Profit target 1: measured move from range, fib 61.8%
💰 profit target
-
$10.5 – Profit target 2: extension to prior support gap
💰 profit target
-
$11.5 – Stop loss above resistance flip for shorts
🛡️ stop loss
Technical Indicators Analysis
📊 Volume Analysis:
Pattern: Declining on upside attempts, spiking on breakdowns
Bearish volume profile—sellers dominate, no accumulation
📈 MACD Analysis:
Signal: Bearish crossover with divergence
MACD line below signal, histogram contracting negative
Applied TradingView Drawing Utilities
This chart analysis utilizes the following professional drawing tools:
Trend LineHorizontal LineFib RetracementRectangleArrow Mark DownCalloutVertical LineShort Position
Disclaimer: This technical analysis by Tyler Fenwick is for educational purposes only and should not be considered as financial advice.
Trading involves risk, and you should always do your own research before making investment decisions.
Past performance does not guarantee future results. The analysis reflects the author’s personal methodology and risk tolerance (high).
Marathon Digital Technical Analysis Chart
Analysis by Tyler Fenwick | Symbol: NASDAQ:MARA | Interval: 1h | Drawings: 7
Technical Analysis Summary
Aggressively mark the dominant downtrend line connecting the swing high on April 22, 2026 at ~$12.30 to the recent swing high on April 28 at ~$11.90, extending it forward for potential short entries. Draw horizontal support at $11.00 (strong, multiple tests) and $11.09 (intraday low), resistance at $11.74 (24h high) and $12.00 (prior consolidation). Use fib retracement from recent low $11.00 to high $12.30 for pullback targets. Rectangle the consolidation zone April 27-29 between $11.00-$11.50. Arrow down on MACD bearish divergence, callout declining volume on bounce. Vertical line on April 27 drop tied to strategy shift news. Long position only on breakout above $11.74 with stop below $11.00, but prefer shorts targeting $10.80.
Risk Assessment: high
Analysis: High vol stock tied to BTC, news catalysts like BTC sales pivot amplify swings; downtrend + weak volume = volatile shorts
Tyler Fenwick’s Recommendation: Aggressive short bias, scale in on $11.20 fails, trail stops—high reward if BTC dumps, but cut fast on reversal.
Key Support & Resistance Levels
📈 Support Levels:
-
$11 – Multi-test base, aligns with prior lows and psychological level
strong -
$11.09 – 24h low, quick bounce zone
moderate
📉 Resistance Levels:
-
$11.74 – 24h high, rejection wick
moderate -
$12 – Prior consolidation ceiling, volume shelf
strong
Trading Zones (high risk tolerance)
🎯 Entry Zones:
-
$11.2 – Short entry on rejection at minor resistance in downtrend, aggressive scalp
high risk -
$11 – Long dip-buy only on volume spike breakout confirmation
high risk
🚪 Exit Zones:
-
$10.8 – Profit target 1: measured move from range, fib 61.8%
💰 profit target -
$10.5 – Profit target 2: extension to prior support gap
💰 profit target -
$11.5 – Stop loss above resistance flip for shorts
🛡️ stop loss
Technical Indicators Analysis
📊 Volume Analysis:
Pattern: Declining on upside attempts, spiking on breakdowns
Bearish volume profile—sellers dominate, no accumulation
📈 MACD Analysis:
Signal: Bearish crossover with divergence
MACD line below signal, histogram contracting negative
Applied TradingView Drawing Utilities
This chart analysis utilizes the following professional drawing tools:
Disclaimer: This technical analysis by Tyler Fenwick is for educational purposes only and should not be considered as financial advice.
Trading involves risk, and you should always do your own research before making investment decisions.
Past performance does not guarantee future results. The analysis reflects the author’s personal methodology and risk tolerance (high).
Network hashrate dips like the recent slide from 994.76 EH/s to 970.63 EH/s hand MARA a profitability boost. Lower difficulty means more blocks mined per EH/s, pumping MARA’s daily BTC output. At 61.7 EH/s, that’s real revenue acceleration. Traders, sync your charts: when network total drops below 975 EH/s and MARA holds steady, stock rips 5-10% in days. We’ve got live proof in April’s adjustment; MARA’s relative dominance lit a fuse under $11.18 shares.
Precision Entries: Hashrate Signals for MARA Buys
Lock in this trading MARA with hashrate metrics edge. Step one: monitor MARA’s energized hashrate daily via filings. When it outpaces network growth by 2% and, buy dips. Example: post-April 18 difficulty cut, MARA’s efficiency edge widened. Shares bottomed near $11.085, then tested $11.74 highs. Pair with BTC treasury: 38,689 coins act as rocket fuel on rallies. Sell signal? Treasury sales announcements, like the March pivot that tanked shares 8.4%. But rebound city when buys resume under twin-turbo mode.
Relentless learning means backtesting. Hashrate surges above 60 EH/s correlated to 15% MARA pops in Q1 2026. Network at 970 EH/s? MARA’s slice fattens to 6.3%, screaming undervalued at P/E 5.18. Enter long above $11.18 with stops at $11.085. Target $23 base case per TIKR analysts, scaling out half at $15 on BTC correlation spikes.
Marathon Digital Holdings Technical Analysis Chart
Analysis by Tyler Fenwick | Symbol: NASDAQ:MARA | Interval: 1h | Drawings: 6
Technical Analysis Summary
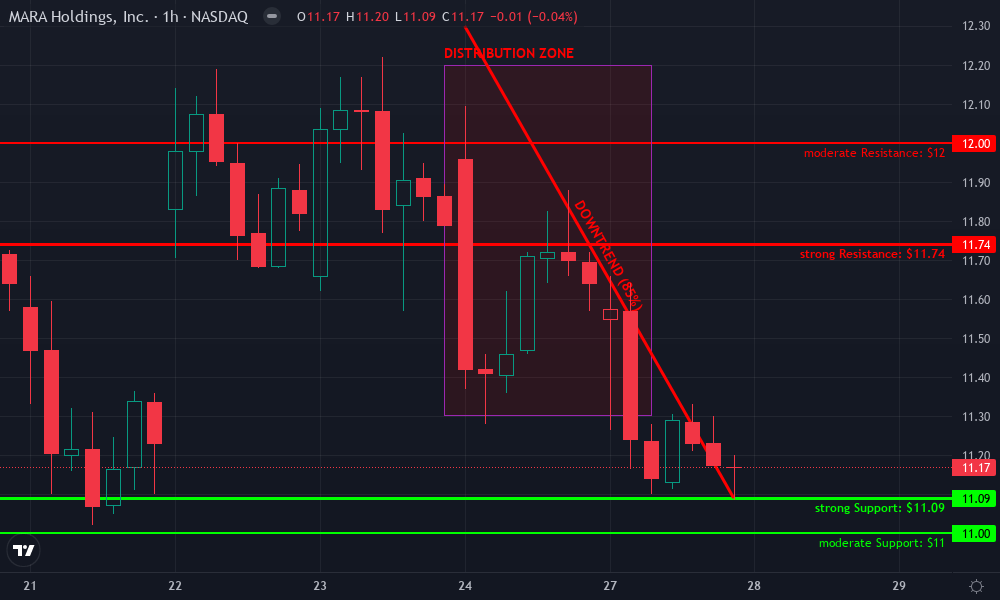
Aggressively mark the downtrend channel from the April 23 high at $12.30 down to recent lows around $11.09 with a steep trend_line (red). Draw horizontal_line supports at $11.00 (strong) and $11.10 (tested multiple times), resistance at $11.74 (24h high) and $12.00 (prior consolidation). Fib_retracement from recent swing high $11.74 to low $11.09 for potential bounce levels at 38.2% ($11.38) and 61.8% ($11.50). Rectangle over the late April 27-29 consolidation zone between $11.10-$11.30. Arrow_mark_down on the high-volume red candles signaling distribution. Long_position entry at $11.10 with stop below $11.00, targeting $11.74. Use callout for MACD bearish divergence warning.
Risk Assessment: high
Analysis: High volatility from BTC correlation and news; aggressive setup but tight stops needed.
Tyler Fenwick’s Recommendation: Go long aggressively at support for quick scalp to $11.74—high reward potential in this volatile miner.
Key Support & Resistance Levels
📈 Support Levels:
-
$11.09 – 24h low and multiple test point, strong intraday support.
strong -
$11 – Psychological round number and chart base.
moderate
📉 Resistance Levels:
-
$11.74 – 24h high, recent rejection zone.
strong -
$12 – Prior consolidation ceiling from April 24.
moderate
Trading Zones (high risk tolerance)
🎯 Entry Zones:
-
$11.1 – Bounce from strong support with volume divergence, aggressive long scalp setup.
high risk
🚪 Exit Zones:
-
$11.74 – 24h high resistance for quick profit take.
💰 profit target -
$11 – Below key support invalidates long.
🛡️ stop loss
Technical Indicators Analysis
📊 Volume Analysis:
Pattern: high volume on downside candles, declining on upside
Bearish volume confirmation on drops, potential exhaustion.
📈 MACD Analysis:
Signal: bearish crossover with weakening momentum
MACD line below signal, histogram contracting—watch for bullish divergence.
Applied TradingView Drawing Utilities
This chart analysis utilizes the following professional drawing tools:
Disclaimer: This technical analysis by Tyler Fenwick is for educational purposes only and should not be considered as financial advice.
Trading involves risk, and you should always do your own research before making investment decisions.
Past performance does not guarantee future results. The analysis reflects the author’s personal methodology and risk tolerance (high).
Crypto Mining Stock Strategies 2026: Risks, Correlations, and Bull Firepower
MARA’s HODL flip to flexible sales is genius for crypto mining stock strategies 2026. No more book value rollercoasters; cash from peak sales funds 60 and EH/s expansion. Debt at $4B? Manageable if Bitcoin holds firm, but volatility’s the killer. Correlation to BTC price is 0.85 and, amplified by hashrate share. Network rebound crushes inefficient miners, leaving MARA dominant.
Table this out for clarity:
Key MARA Metrics vs Network (2026 Q1) 📈
| Metric | Value |
|---|---|
| Hashrate | MARA: 61.7 EH/s | Network: 970 EH/s | Share: 6.4% 📈 |
| BTC Holdings | 38,689 BTC 💰 |
| Difficulty Change | -2.43% (Apr) |
| Stock P/E | 5.18 |
| EPS | $2.16 |
| Current Price | $11.18 (-3.95% 24h) |
| Price Targets | $23 base, $30-$40 bull 🚀 |
Watch EPS beats tied to hashrate. $2.16 screams cheap versus growth. Bull case: Bitcoin to $150k doubles treasury, funds debt paydown, stock to $40. Bear? Prolonged crash sinks miners first. Your move: hedge with hashrate futures proxies if available, but direct MARA calls on network dips.
MARA Trading Guide: Bitcoin Correlation Mastery
Dive deeper into MARA trading guide Bitcoin correlation. Overlay hashrate charts with price action. April’s 970 EH/s low? Perfect storm for longs. MARA’s 60.4 EH/s ops pre-expansion already crushed peers. Post-twin-turbo, expect 10x leverage on BTC moves. A $10k Bitcoin swing? MARA jumps 20-30% historically.
Day trade scalps: 1% network dip buys MARA 15-min opens. Swing: hold through earnings if hashrate beats. Speed executes: set alerts for EH/s reports, difficulty adjustments. Precision profits: trail stops on BTC treasury updates. At $11.18, market cap $5.26B undervalues the beast. Grab shares now, ride the hashrate wave to $23 and. Relentless traders win; hesitation loses. Scale in, dominate 2026.