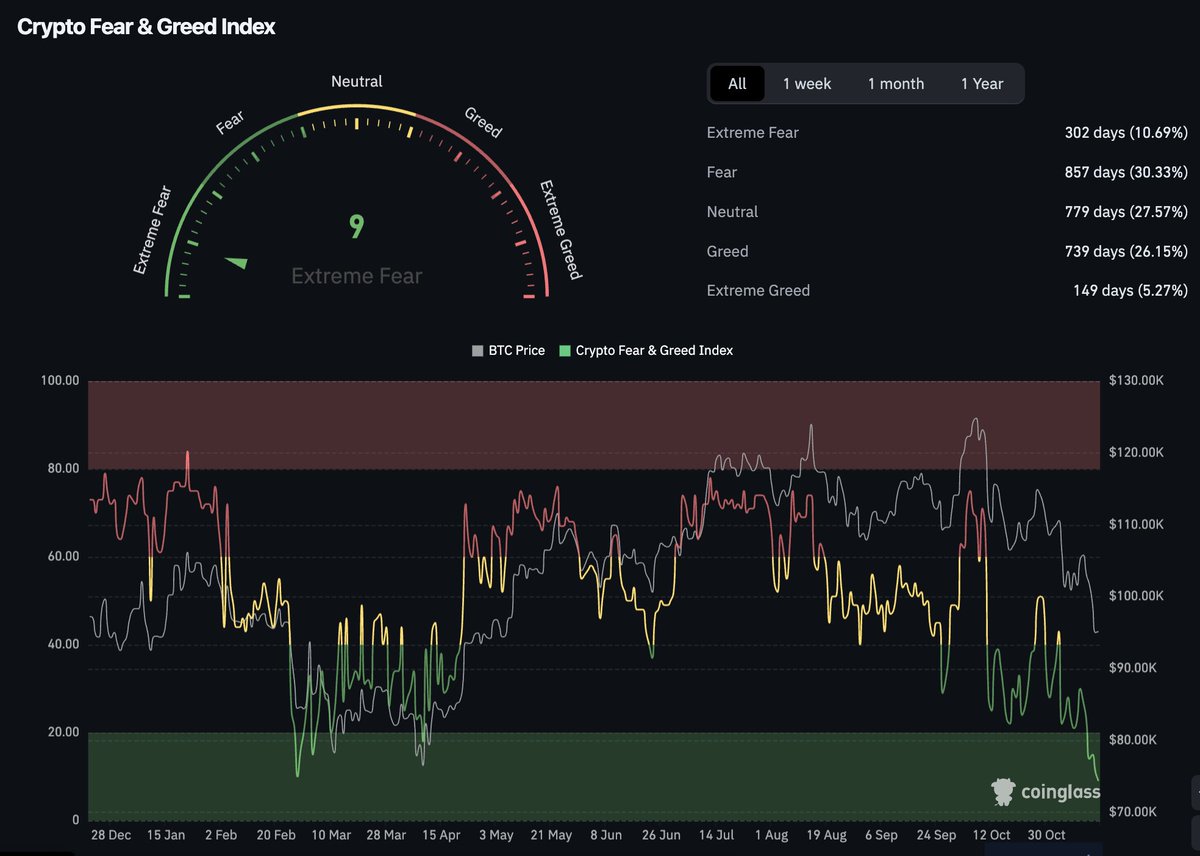
Market sentiment in crypto is at its most fragile point of 2025. As of November 20, the Crypto Fear and Greed Index stands at a stark 10, signaling “Extreme Fear” not seen since February. Bitcoin (BTC) currently trades at $91,779, and Ethereum (ETH) holds at $3,026.12. These figures reflect a market where panic dominates headlines, but for disciplined traders, such conditions often conceal the seeds of future opportunity.
Bitcoin (BTC) Live Price
Powered by TradingView
Trade BTC
Why Extreme Fear Creates Unique Trading Opportunities
Historically, periods of extreme fear have marked pivotal moments in the crypto market. The last time the index hovered around these levels was during the COVID-19 crash in March 2020 – a precursor to one of Bitcoin’s most dramatic rallies. While fear can paralyze less experienced investors, seasoned traders recognize that mass panic can create asymmetric risk-reward setups.
But capitalizing on these moments requires more than just courage; it demands precision and a systematic approach. Here are five actionable strategies tailored for navigating the current climate:
5 Actionable Crypto Trading Strategies for Extreme Fear in 2025
Monitor the Crypto Fear and Greed Index for Contrarian Entry PointsTrack the Crypto Fear & Greed Index, which currently sits at 10 (Extreme Fear). Historically, such levels have often preceded market recoveries. Contrarian traders can use this indicator to spot potential buying opportunities when sentiment is at its lowest.
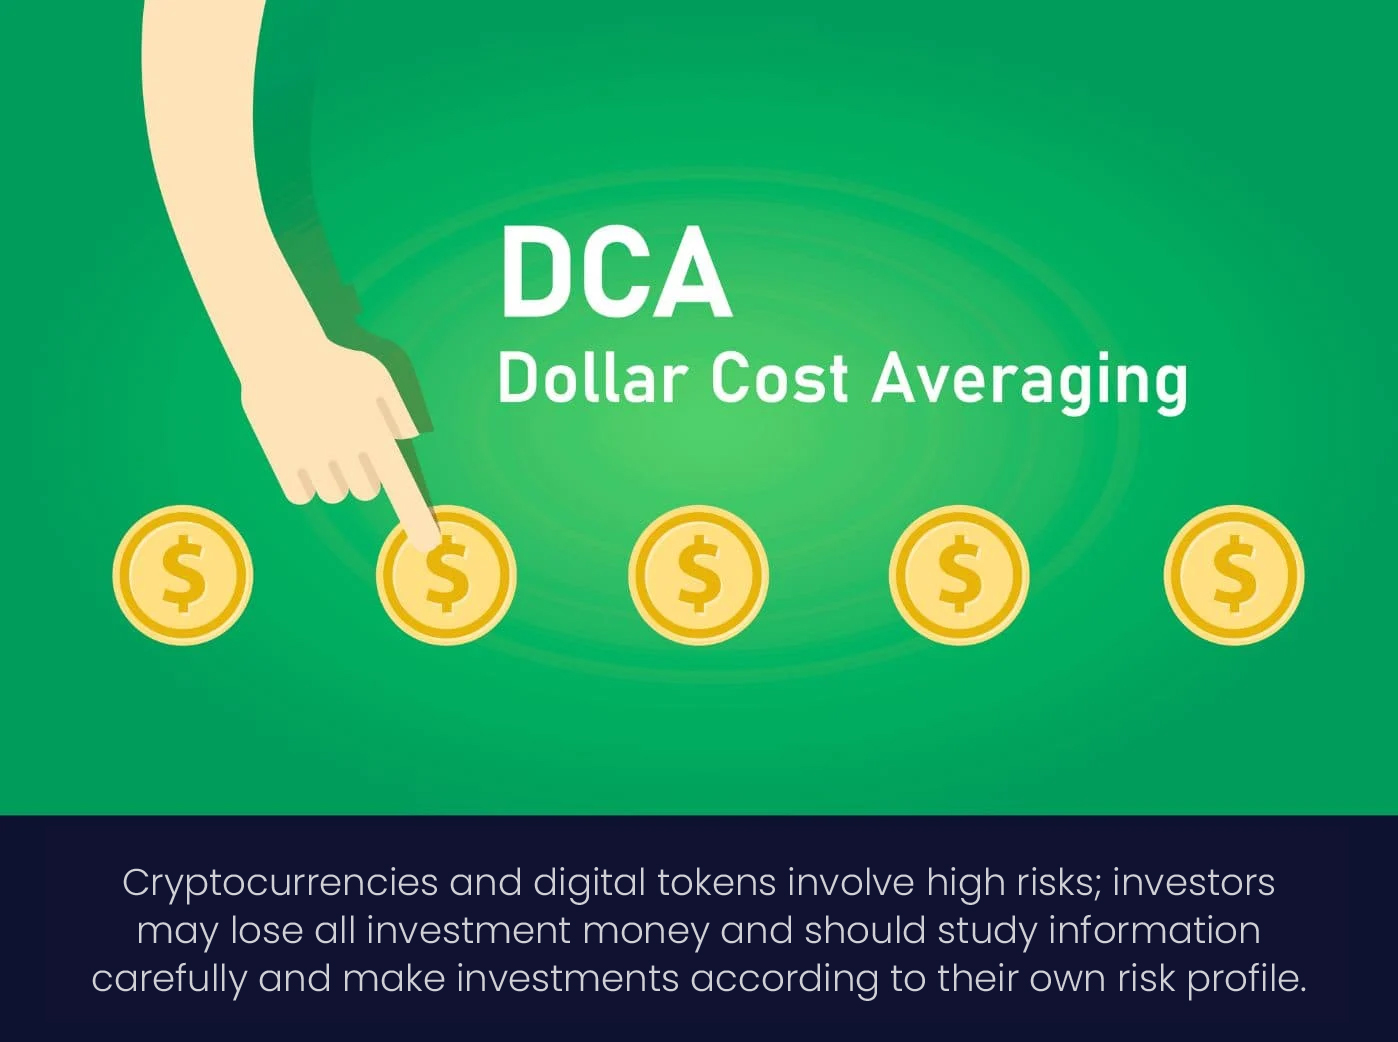
Scale In with Dollar-Cost Averaging (DCA) During Panic Sell-OffsInvest a fixed amount at regular intervals, regardless of price fluctuations. For example, buying Bitcoin at set intervals as it trades between $88,549 and $93,021 helps reduce the impact of volatility and avoids emotional decision-making.
Deploy Tight Stop-Losses and Dynamic Position Sizing to Manage VolatilityProtect your capital by setting stop-loss orders just below key support levels (e.g., Bitcoin’s recent low of $88,549). Adjust your position sizes based on volatility to limit exposure during sharp downturns.
Focus on High-Quality Assets (Bitcoin, Ethereum) Over Riskier AltcoinsConcentrate on established cryptocurrencies like Bitcoin (BTC) at $91,779 and Ethereum (ETH) at $3,026.12. These assets tend to be more resilient during extreme fear compared to speculative altcoins.
Utilize On-Chain Analytics to Identify Accumulation by WhalesLeverage platforms like Glassnode or CryptoQuant to monitor large wallet activity. Whale accumulation during fear phases can signal a potential market bottom and future price appreciation.
1. Monitor the Crypto Fear and Greed Index for Contrarian Entry Points
The Fear and Greed Index is an indispensable tool in today’s volatile environment. With sentiment scraping historic lows, contrarian traders look to this index as a signal to start accumulating positions against the crowd. When the index dips into single digits or low teens – as it has now – historical data suggests that downside risk may be limited compared to potential upside.
This doesn’t mean blindly buying every dip; instead, use the index as one input among many in your decision-making process. For an in-depth guide on integrating this indicator into your trading framework, see our resource on profitable Fear and Greed Index strategies for 2025.
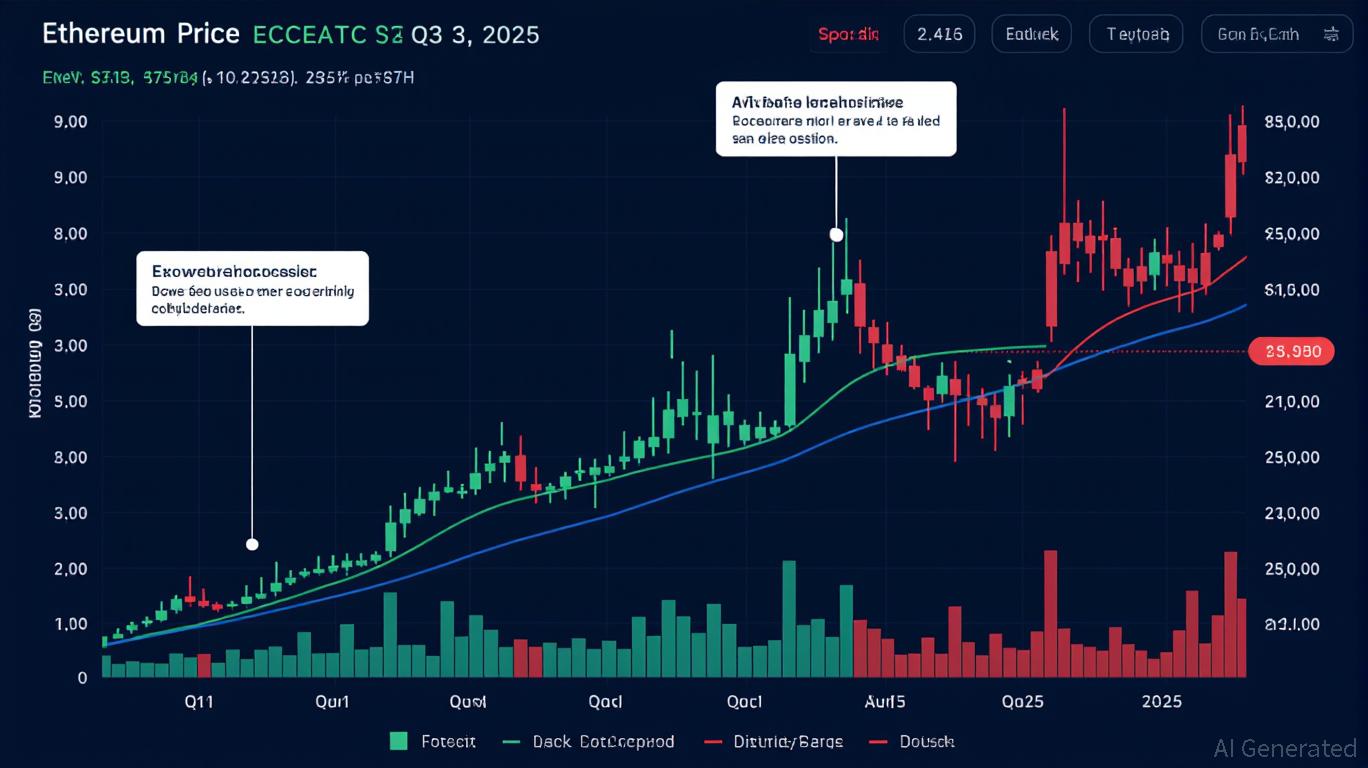
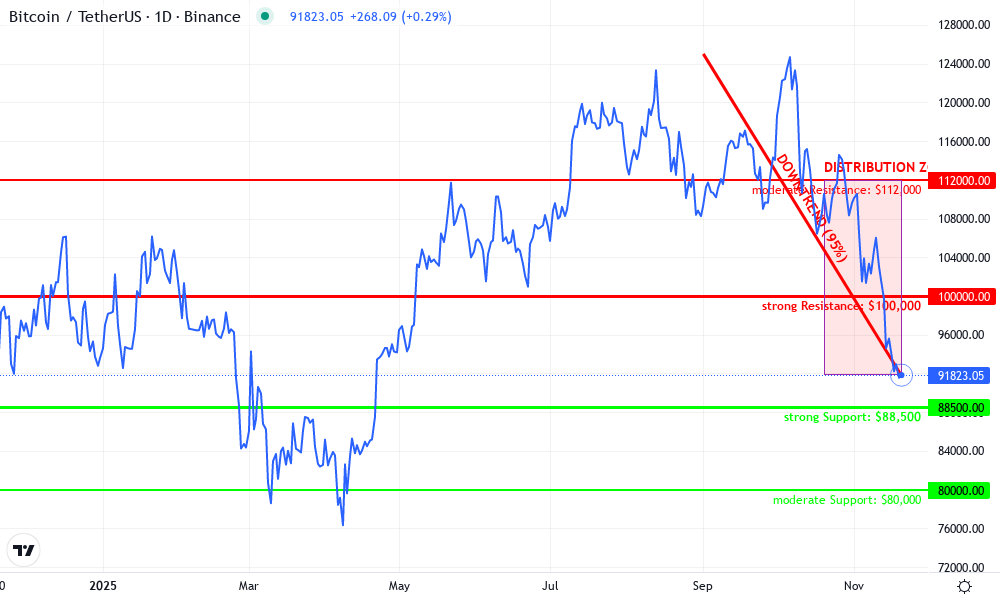
Evan Whitmore is a CFA charterholder with over 12 years of experience in global equities and digital assets. He specializes in macroeconomic trend analysis and risk management, helping investors navigate complex markets with a data-driven, conservative approach. Evan is passionate about investor education and believes ‘Sound analysis builds wealth.’
As a fundamentally-driven, conservative investor, I see the recent price action as a reflection of both macro uncertainty and market sentiment extremes. The steep drop into November 2025, paired with a Fear & Greed Index reading of 10, signals capitulation risk but also the potential for a contrarian opportunity. Historically, such sentiment often marks at least a temporary bottom, but from a risk management perspective, I would wait for confirmation of stabilization before considering new allocations. Key support levels should be respected, and any break below $88,500 could accelerate downside momentum. Patience and a systematic approach like DCA remain prudent in this environment.
Technical Analysis Summary
To thoroughly analyze this chart, I recommend first plotting a horizontal support line at approximately $88,500 (recent low), and another at $91,800 (current price). Draw a resistance line near $100,000, as this was previously a key psychological and price level. Use a downward sloping trend line from the early September 2025 high (~$125,000) to the current level, marking the prevailing downtrend. Highlight the sharp drop from late October to November 2025 using a rectangle to indicate a distribution/sell-off zone. Add a callout at the current price to note the proximity to recent lows and the ‘Extreme Fear’ sentiment. Consider marking the prior consolidation zone (June–September 2025) with another rectangle for context. For volume and MACD, use text or callouts as only price action is visible.
Risk Assessment:medium
Analysis: Current conditions are highly volatile, with extreme fear suggesting possible short-term bottom, but technicals remain bearish and price is near key support.A patient approach is warranted.
Evan Whitmore’s Recommendation: For conservative investors, avoid aggressive entries . Consider gradual DCA only if price stabilizes above $88,500 and monitor for reversal signals.Maintain strict risk controls and respect stop-loss levels.
Key Support & Resistance Levels
📈 Support Levels :
$88,500 – Recent intraday low and first major support below current price.strong
$80,000 – Round number and prior consolidation lows in Q2 2025.moderate
📉 Resistance Levels :
$100,000 – Major psychological and former support level , now acting as resistance.strong
$112,000 – Intermediate resistance from late September/early October 2025.moderate
Technical Indicators Analysis 📊 Volume Analysis :Pattern : Assumed volume spike on recent sell-off ; this is typical in capitulation phases.Expected elevated volume in the sharp decline to current levels ; look for volume divergence or drying up to signal a bottom.
📈 MACD Analysis :Signal : Likely bearish , with potential for bullish divergence if price stabilizes.MACD likely trending down , but watch for flattening or positive cross as an early reversal signal.
Applied TradingView Drawing Utilities This chart analysis utilizes the following professional drawing tools:
Trend LineHorizontal LineRectangleCalloutText
Disclaimer:This technical analysis by Evan Whitmore is for educational purposes only and should not be considered as financial advice.Trading involves risk,and you should always do your own research before making investment decisions.Past performance does not guarantee future results.The analysis reflects the author’s personal methodology and risk tolerance (low).
2. Scale In with Dollar-Cost Averaging (DCA) During Panic Sell-Offs
Panic selling often leads to sharp price dislocations that are difficult to time perfectly. Dollar-cost averaging (DCA) offers a disciplined way to gain exposure without trying to call the exact bottom. By investing fixed amounts at regular intervals – regardless of short-term volatility – you smooth out entry prices and reduce regret-driven mistakes.
This strategy is especially effective when sentiment is deeply negative but fundamentals remain intact for major assets like Bitcoin and Ethereum. With BTC oscillating between $88,549 and $93,021 intraday, DCA enables gradual accumulation through turbulent swings.
Bitcoin (BTC) Price Prediction 2026-2031: Navigating Extreme Fear Markets
Comprehensive outlook for BTC under current extreme fear conditions, including minimum, average, and maximum price scenarios for 2026-2031.
Year
Minimum Price
Average Price
Maximum Price
Yearly % Change (Avg)
Scenario Insights
2026
$75,000
$102,000
$135,000
+11%
Recovery phase post-extreme fear; volatility persists, but historical patterns suggest accumulation and rebound. Min reflects potential for further dips if macro fears persist.
2027
$90,000
$120,000
$160,000
+18%
Growing institutional adoption and possible regulatory clarity drive up average prices; max scenario assumes risk-on sentiment returns.
2028
$110,000
$142,000
$200,000
+18%
Next Bitcoin halving (expected 2028) historically boosts prices; increased Layer 2 adoption and payment use cases support growth.
2029
$120,000
$160,000
$240,000
+13%
Market maturity and wider adoption; regulations stabilize, but competition from CBDCs and altcoins caps max upside.
2030
$135,000
$178,000
$260,000
+11%
Continued institutional inflows and global adoption; potential for new all-time highs if macroeconomic conditions are favorable.
2031
$130,000
$195,000
$285,000
+10%
Market enters late-stage bull cycle; technological advancements and ETF expansion drive price, but profit-taking and macro risks temper gains.
Price Prediction Summary
Despite the current extreme fear gripping the crypto market, historical trends indicate that such periods often precede significant price recoveries for Bitcoin. Our projections suggest a steady upward trajectory for BTC over the next six years, with average prices potentially doubling by 2031. However, investors should be prepared for significant volatility, with minimum scenarios reflecting potential for further downside in the event of extended macroeconomic or regulatory headwinds.
Key Factors Affecting Bitcoin Price
Historical precedent of market rebounds following ‘Extreme Fear’ sentiment readings.
Impact of Bitcoin halving cycles (next in 2028) on supply dynamics and price.
Institutional adoption and development of regulated crypto investment products (e.g., ETFs).
Global regulatory developments, including potential for stricter or more favorable frameworks.
Technological improvements such as Layer 2 scaling and integration with traditional finance.
Competition from alternative cryptocurrencies and central bank digital currencies (CBDCs).
Macro-economic factors such as inflation, interest rates, and geopolitical tensions affecting risk appetite.
Disclaimer: Cryptocurrency price predictions are speculative and based on current market analysis.
Actual prices may vary significantly due to market volatility, regulatory changes, and other factors.
Always do your own research before making investment decisions.
3. Deploy Tight Stop-Losses and Dynamic Position Sizing to Manage Volatility
The hallmark of extreme fear markets is heightened volatility – rapid swings can liquidate overleveraged or poorly managed positions within minutes. To protect capital:
Tighten stop-losses: Place stops closer than usual to minimize losses if momentum accelerates downward.
Dynamically size positions: Reduce trade sizes when volatility spikes or uncertainty increases; only scale up when conviction is high and risk is clearly defined.
This risk-first approach ensures you stay solvent long enough to benefit from any eventual recovery.
4. Focus on High-Quality Assets (Bitcoin, Ethereum) Over Riskier Altcoins
Periods of extreme fear tend to expose the vulnerabilities of lower-quality projects. Historically, blue-chip cryptocurrencies like Bitcoin (BTC) and Ethereum (ETH) have demonstrated greater resilience during market downturns compared to speculative altcoins. As of November 20,2025, Bitcoin is priced at $91,779 and Ethereum at $3,026.12. Both assets maintain robust liquidity and institutional interest, making them safer harbors when sentiment is at its nadir.
While some altcoins may offer outsized returns during risk-on rallies, they are disproportionately affected during panic-driven sell-offs. Prioritizing high-quality assets helps safeguard your portfolio against deep drawdowns and ensures exposure to potential recoveries once market conditions stabilize.
5. Utilize On-Chain Analytics to Identify Accumulation by Whales
On-chain data provides real-time insight into the behavior of large holders, often referred to as “whales. ” During periods of extreme fear, tracking wallet flows can reveal whether sophisticated investors are accumulating or distributing assets. For instance, a surge in large Bitcoin wallet inflows around current price levels ($91,779) may signal smart money positioning for a rebound.
Leverage analytics platforms that monitor exchange balances, whale transactions, and network activity. When these metrics show accumulation while retail sentiment remains fearful, it can be a powerful contrarian buy signal.
Checklist: Staying Disciplined in Extreme Fear Markets
Disciplined Crypto Trading Steps for Extreme Fear Markets
Monitor the Crypto Fear & Greed Index for contrarian entry points—consider accumulating when the index is at ‘Extreme Fear’ (currently 10).📊
Scale in with Dollar-Cost Averaging (DCA) during panic sell-offs—invest a fixed amount regularly, regardless of price swings.💸
Deploy tight stop-losses and adjust position sizes dynamically to manage heightened volatility.🛡️
Focus on high-quality assets such as Bitcoin ($91,779) and Ethereum ($3,026.12) over riskier altcoins during uncertain conditions.🏆
Utilize on-chain analytics to identify accumulation by large holders (‘whales’), signaling potential market strength beneath fear.🐋
You’ve completed all the disciplined steps for trading crypto during extreme fear—stay vigilant, adapt, and trade with confidence.
Navigating a crypto market gripped by fear requires more than technical skill, it demands emotional discipline and adherence to proven strategies. By systematically monitoring the Fear and Greed Index, scaling in with DCA during panic phases, deploying rigorous risk controls, focusing on high-conviction assets like BTC and ETH, and leveraging on-chain analytics for whale activity signals, traders can turn volatility into opportunity rather than disaster.
The current environment, marked by Bitcoin trading at $91,779, Ethereum at $3,026.12, and the Fear and Greed Index at 10, offers both significant risks and rare opportunities for those prepared to act rationally while others capitulate.
Evan Whitmore is a CFA charterholder with over 12 years of experience in global equities and digital assets. He specializes in macroeconomic trend analysis and risk management, helping investors navigate complex markets with a data-driven, conservative approach. Evan is passionate about investor education and believes 'Sound analysis builds wealth.'