
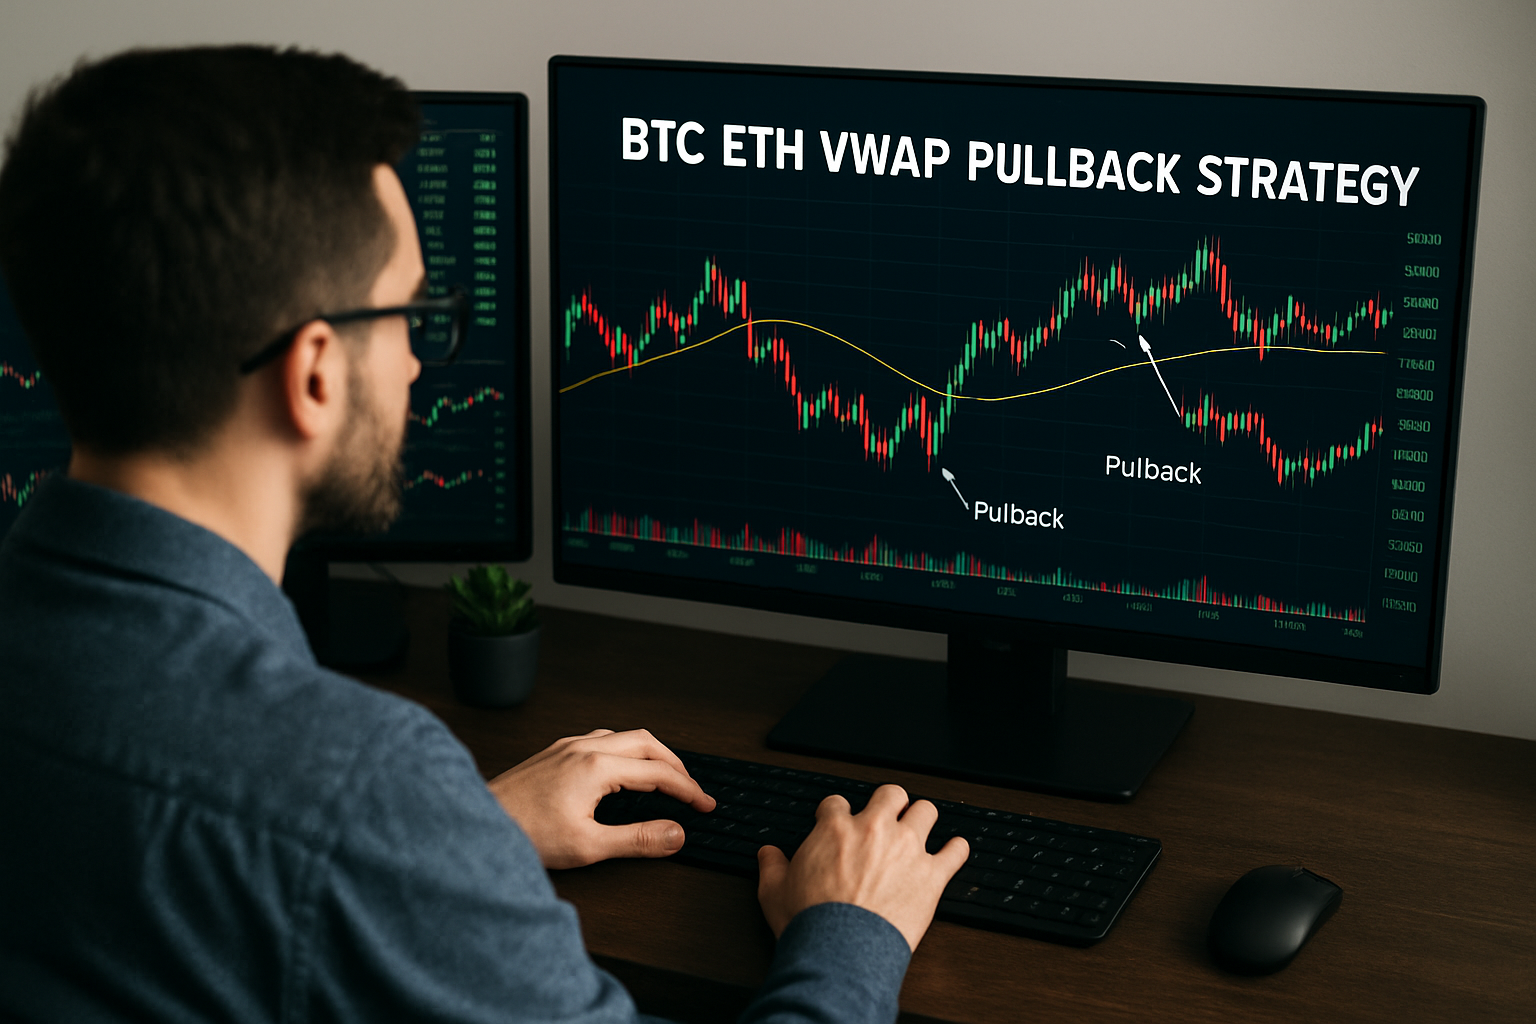
Crypto traders are constantly searching for reliable tools to navigate the volatility of the digital asset markets. In 2025, as Bitcoin trades at $110,949.00 and Ethereum hovers around $3,974.04, mastering pullback trading using VWAP (Volume Weighted Average Price) has become an essential skill for both day traders and swing traders. Understanding how to combine VWAP with time-based strategies can help you pinpoint high-probability entry points, manage risk, and ride trends with greater confidence.

VWAP: The Institutional Standard for Crypto Pullback Trading
VWAP is more than just a line on your chart. It’s the average price paid for a crypto asset throughout a trading session, weighted by volume. This makes it a favorite among institutional traders, who use it to gauge whether an asset is trading at a premium or discount relative to the day’s typical flow.
In the context of crypto trading strategies, VWAP acts as a dynamic support or resistance level. When prices pull back to VWAP during an uptrend, it often signals a potential entry point, especially if the trend is supported by robust volume and clear higher highs and higher lows. Conversely, in a downtrend, rallies to VWAP may offer shorting opportunities.
For example, with Bitcoin currently at $110,949.00, a trader might wait for a pullback toward the VWAP line before considering a long entry, provided that the broader trend remains bullish and volume confirms the move.
How to Plot VWAP and Standard Deviation Bands for Crypto Pullbacks
To refine your entries, many traders plot one and two standard deviation bands around the VWAP. These bands act like a volatility envelope, helping you identify when prices are stretched and due for mean reversion.
- Stage One Trends: In early-stage uptrends, watch for pullbacks to the and 1 standard deviation band or directly to VWAP itself.
- Bands as Dynamic Levels: In sideways or consolidating markets, these bands can provide early warning of potential reversals or fakeouts.
Pairing VWAP bands with time-based strategies, such as waiting for a 15-minute candle to close decisively above VWAP, can further filter out noise and improve your crypto entry and exit points.
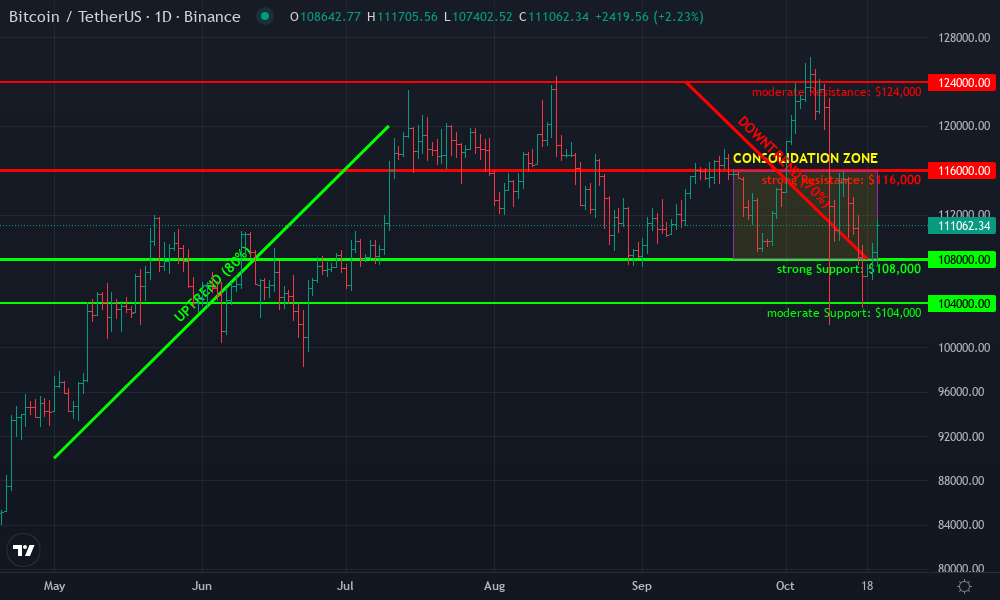
Bitcoin Technical Analysis Chart
Analysis by Darren Kirkwood | Symbol: BINANCE:BTCUSDT | Interval: 1D | Drawings: 7
Technical Analysis Summary
Draw horizontal support lines at $108,000 and $104,000 to mark prior reaction lows. Add a horizontal resistance line near $116,000, which has repeatedly capped rallies since August 2025. For trend visualization, mark the rising trend line from May 2025 lows to the June/July price surge, then draw a downtrend line from the September 2025 high to recent lower highs. Use a rectangle to highlight the current consolidation range ($108,000–$116,000). An arrow marker should indicate the recent sharp bounce from $108,000 support. Use text/callouts to note key VWAP pullback entries, especially near the $110,000 level where price is currently stabilizing.
Risk Assessment: medium
Analysis: While $108,000 support is holding, the inability to break $116,000 resistance highlights risk of further range-bound or downward movement. Macro and technical uncertainty warrant caution.
Darren Kirkwood’s Recommendation: Remain patient. Only consider low-risk entries on confirmed bounces from $108,000 with tight stops, or on a decisive breakout above $116,000. Capital preservation remains my priority until a clear directional signal emerges.
Key Support & Resistance Levels
📈 Support Levels:
-
$108,000 – Recent swing low and area of repeated buying interest.
strong -
$104,000 – Secondary support zone, marking a prior flush low.
moderate
📉 Resistance Levels:
-
$116,000 – Repeated rejection level since August 2025, capping upside momentum.
strong -
$124,000 – September 2025 local high; likely to act as significant resistance if tested.
moderate
Trading Zones (low risk tolerance)
🎯 Entry Zones:
-
$108,000 – Potential for VWAP pullback entry if price stabilizes, as per current VWAP strategies.
low risk
🚪 Exit Zones:
-
$116,000 – Major resistance; conservative profit-taking zone.
💰 profit target -
$104,000 – If price closes below $108,000, next logical stop-loss area is $104,000.
🛡️ stop loss
Technical Indicators Analysis
📊 Volume Analysis:
Pattern: Volume surges on sell-offs, moderate on bounces, suggesting caution on aggressive buying.
Monitor for volume confirmation on any breakout or breakdown through key levels.
📈 MACD Analysis:
Signal: Likely bearish or neutral, given recent lower highs and failed rallies.
MACD has likely crossed below signal recently; wait for a bullish crossover before considering new longs.
Applied TradingView Drawing Utilities
This chart analysis utilizes the following professional drawing tools:
Disclaimer: This technical analysis by Darren Kirkwood is for educational purposes only and should not be considered as financial advice.
Trading involves risk, and you should always do your own research before making investment decisions.
Past performance does not guarantee future results. The analysis reflects the author’s personal methodology and risk tolerance (low).
Time-Based Entry Tactics: More Than Just Price Levels
While price is king, timing matters. Many seasoned traders use time-based confirmations alongside VWAP levels to avoid false signals, especially in fast-moving crypto markets where liquidity can shift rapidly.
A popular approach is to wait for a candle (such as 5-minute, 15-minute, or hourly) to close above (for longs) or below (for shorts) the VWAP after a pullback. This reduces the risk of jumping in too early during a volatile session.
Let’s say Ethereum, currently at $3,974.04, pulls back to its intraday VWAP after a sharp morning rally. Instead of buying immediately, a patient trader might wait for a 15-minute candle to close above the VWAP with increased volume, signaling that buyers have regained control.
Bitcoin (BTC) Price Prediction 2026-2031 Using VWAP Pullback Strategies
Forecast based on technical VWAP pullback strategies, current 2025 market data, and anticipated market dynamics.
| Year | Minimum Price (Bearish Scenario) | Average Price (Base Case) | Maximum Price (Bullish Scenario) | Potential % Change (Avg.) |
|---|---|---|---|---|
| 2026 | $87,000 | $120,000 | $145,000 | +8% |
| 2027 | $95,000 | $135,000 | $170,000 | +12.5% |
| 2028 | $105,000 | $151,000 | $198,000 | +11.8% |
| 2029 | $118,000 | $168,000 | $230,000 | +11.3% |
| 2030 | $132,000 | $186,000 | $265,000 | +10.7% |
| 2031 | $145,000 | $205,000 | $300,000 | +10.2% |
Price Prediction Summary
Bitcoin is forecasted to experience steady growth over the next six years, with the average price rising from $120,000 in 2026 to $205,000 by 2031. VWAP-based pullback strategies suggest that periodic corrections will provide entry opportunities in a long-term uptrend. The minimum price estimates reflect possible market corrections and regulatory risks, while maximum prices reflect accelerated adoption and bullish cycles. The average annual growth rate is projected between 8% and 13%.
Key Factors Affecting Bitcoin Price
- Market adoption of Bitcoin as a store of value and payment asset.
- VWAP-based trading strategies attracting institutional and algorithmic traders.
- Potential regulatory clarity or restrictions in major markets (US, EU, Asia).
- Advancements in Bitcoin scalability, security, and integration with DeFi.
- Global macroeconomic trends (e.g., inflation, monetary policy, geopolitical risks).
- Competition from Ethereum and other smart contract platforms.
- Bitcoin halving cycles and their impact on supply dynamics.
- Market sentiment shifts and capital rotation between crypto assets.
Disclaimer: Cryptocurrency price predictions are speculative and based on current market analysis.
Actual prices may vary significantly due to market volatility, regulatory changes, and other factors.
Always do your own research before making investment decisions.
If you’re interested in a step-by-step breakdown of these methods, or want to see how professional traders refine their entries using VWAP and time-based signals, check out our in-depth guide: How to Use VWAP Pullback Strategies for Consistent Crypto Trading Profits.
Effective pullback trading is as much about discipline as it is about technical analysis. By combining VWAP with time-based entry tactics, you can avoid emotional trades and instead focus on high-probability setups that align with your overall market thesis. As always, risk management should be front and center in your trading plan.
Risk Management: Protecting Capital in a Fast-Moving Market
With Bitcoin holding steady at $110,949.00 and Ethereum at $3,974.04, the stakes are high for every trade you place. A well-structured risk management strategy is crucial when using VWAP pullbacks:
Essential Risk Management Rules for Crypto Pullbacks
-
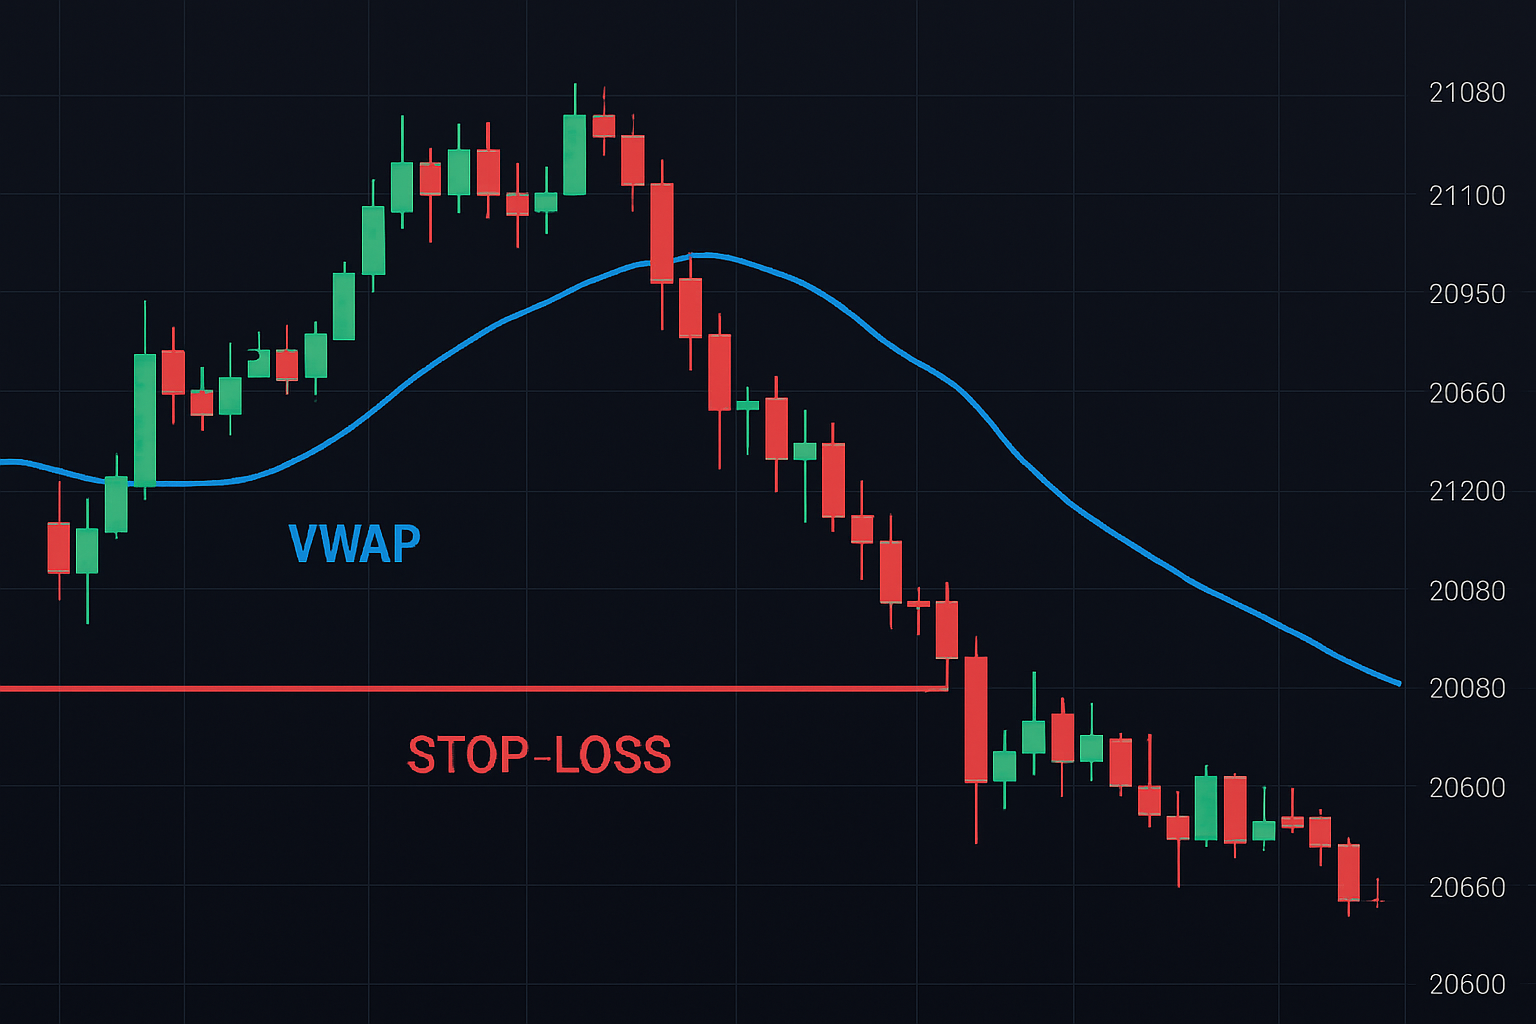
Always Set a Stop-Loss Below VWAP Bands. When trading pullbacks using VWAP, set your stop-loss just below the lower standard deviation band to limit losses if the price fails to reclaim VWAP support.
-
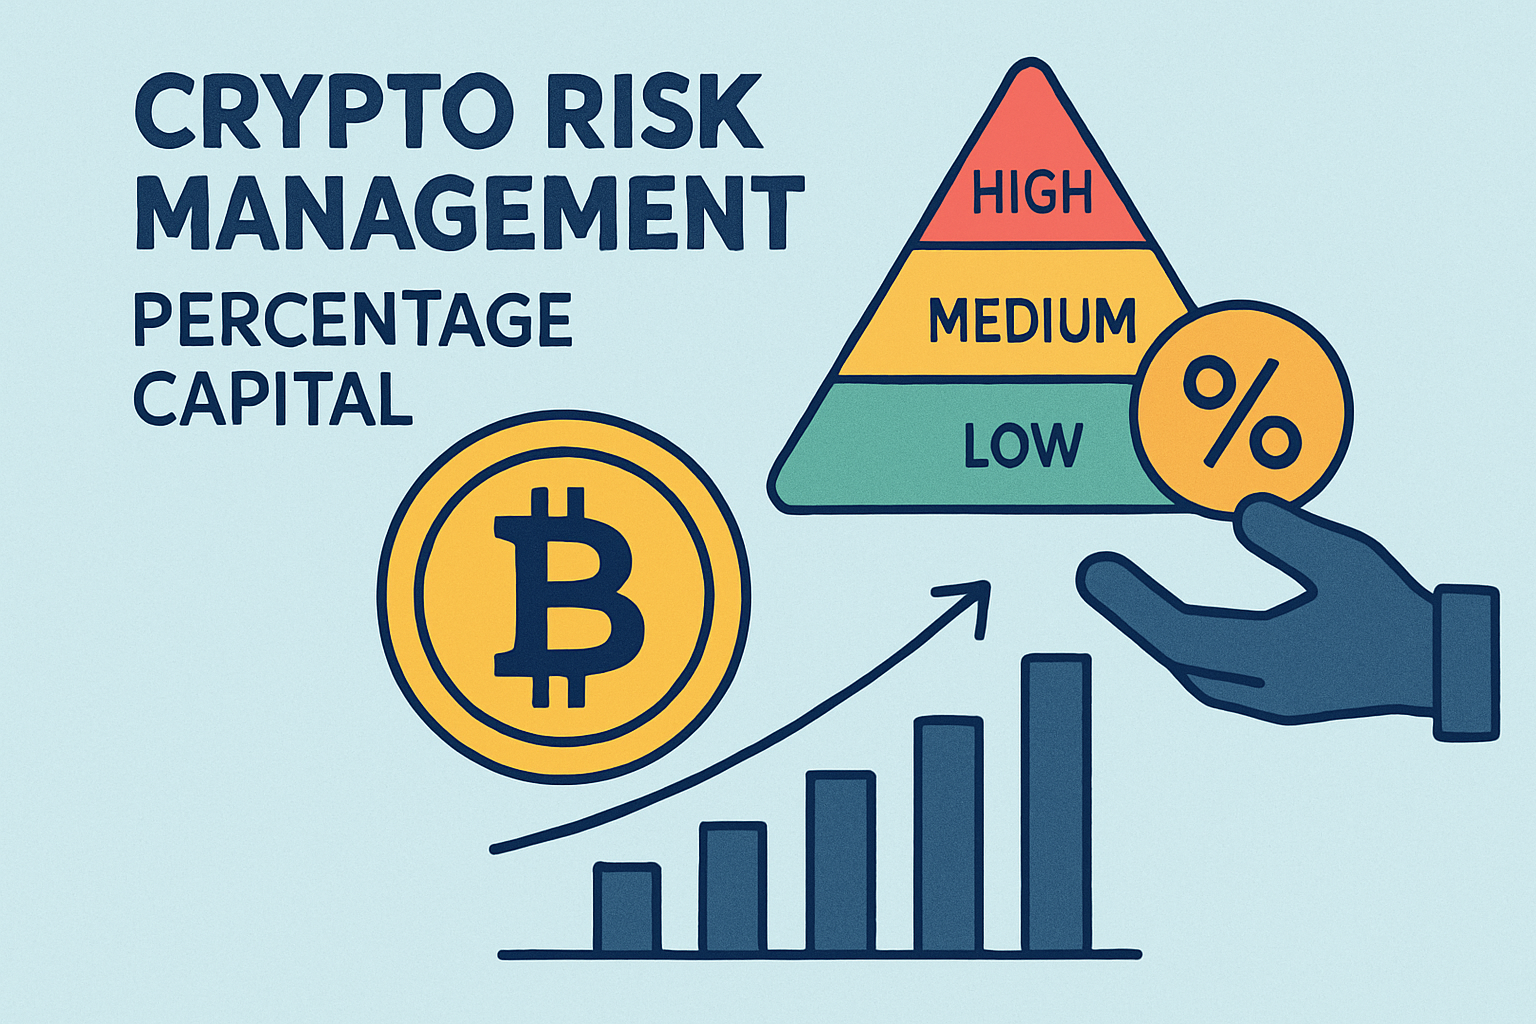
Risk Only a Small Percentage of Your Capital. Limit each trade to risking 1-2% of your total account balance. This helps preserve capital and prevents large drawdowns during volatile moves, such as Bitcoin’s recent swings between $107,510 and $111,647.
-
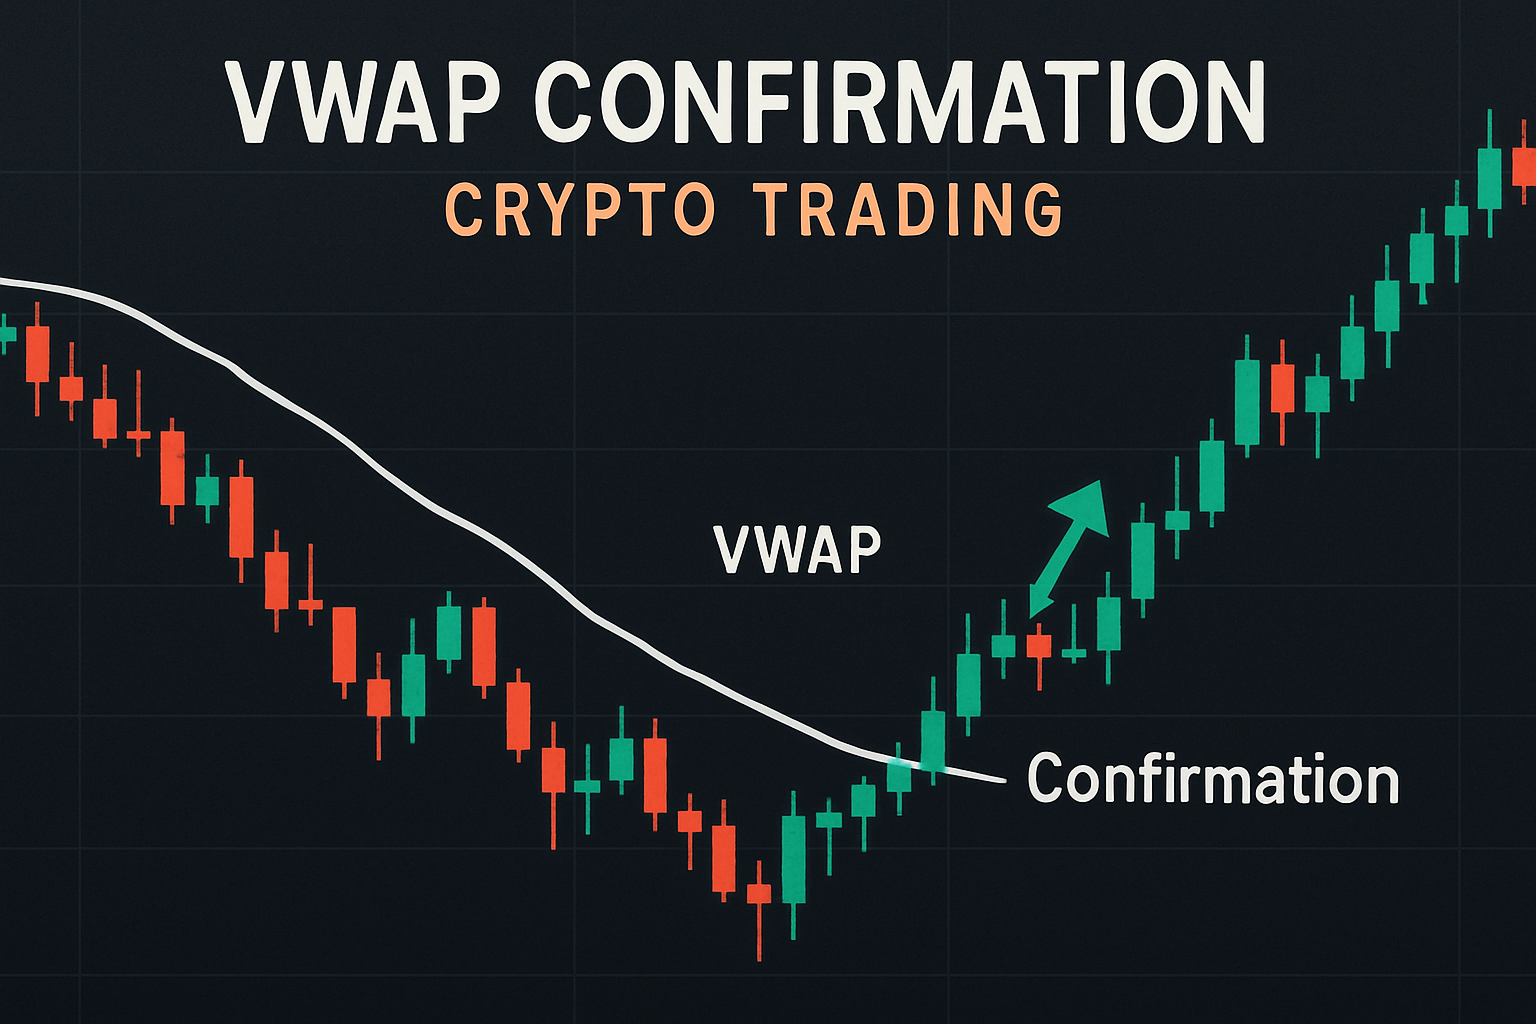
Wait for Confirmation Above VWAP Before Entering. Only enter long trades after a decisive candle close above VWAP in an uptrend, as seen in current Bitcoin (BTC) price action at $110,949. This reduces the risk of false breakouts.
-

Avoid Trading During Major News or High Volatility Events. Sudden news can cause sharp price movements that break through VWAP levels unpredictably. Use reliable news sources like CoinDesk to stay informed.
-
Review and Adjust Your Strategy Regularly. Analyze your trades and adapt your VWAP and time-based strategies based on recent market data, such as Ethereum’s price range from $3,913.09 to $4,082.55.
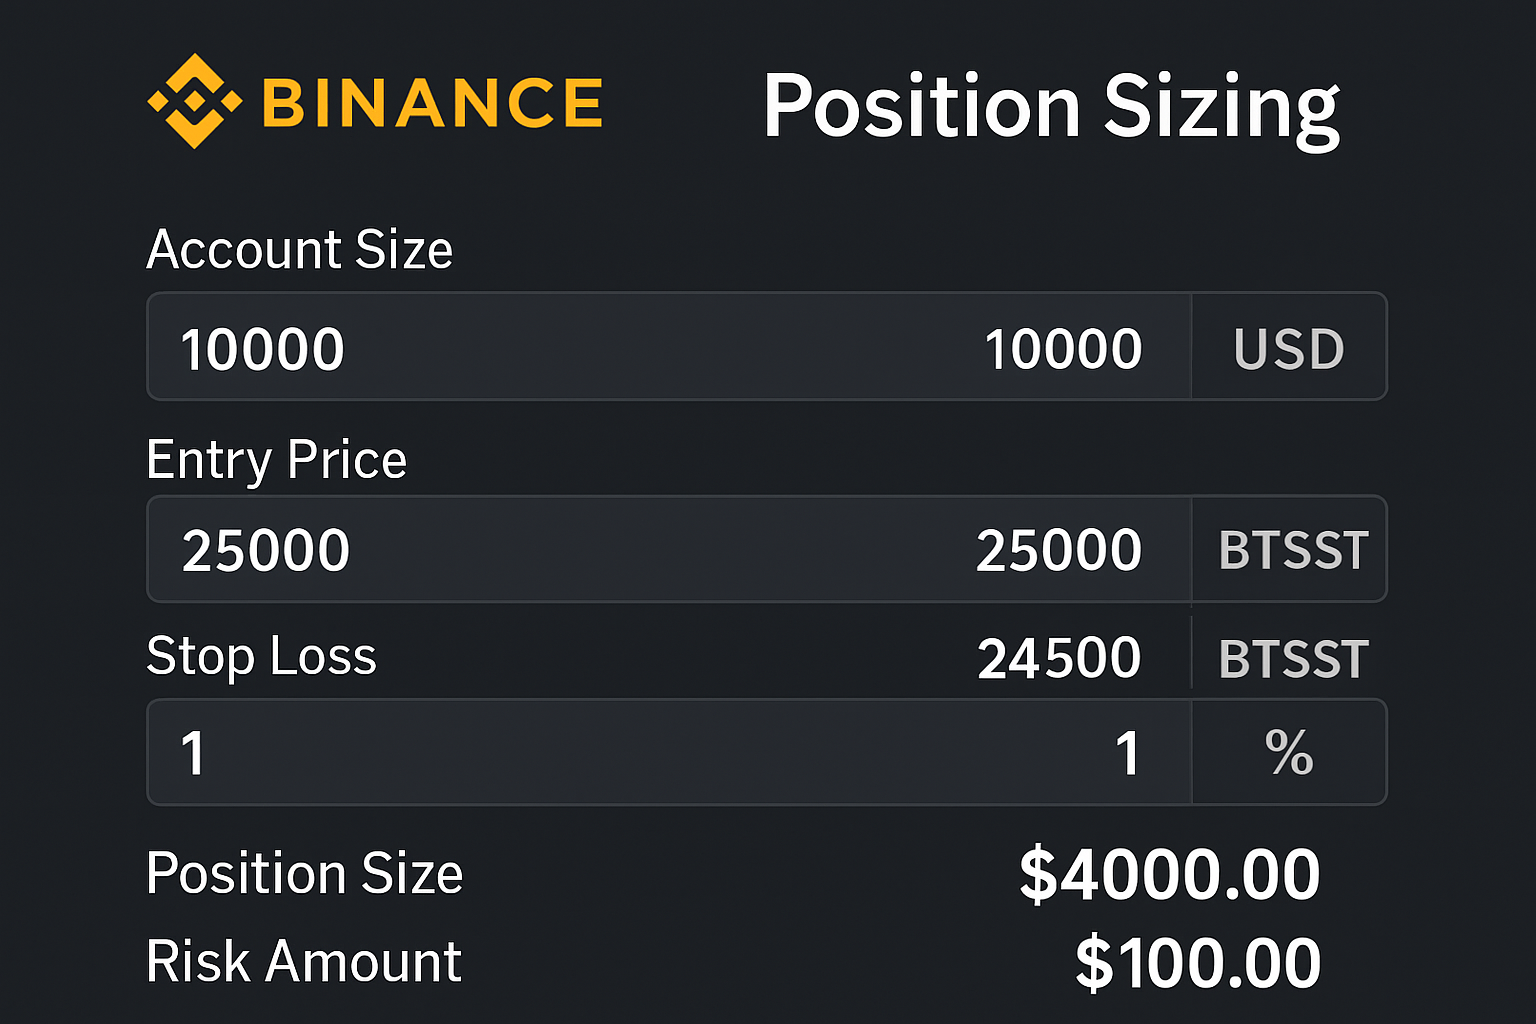
Always define your stop-loss before entering a trade, often just below the VWAP or the lower standard deviation band in an uptrend. Position sizing should reflect both your confidence in the setup and the inherent volatility of the asset. Remember, a single loss should never jeopardize your trading capital or mindset.
Common Mistakes to Avoid When Trading Pullbacks with VWAP
- Chasing price moves: Entering before confirmation can expose you to sudden reversals.
- Ignoring volume: A pullback to VWAP without strong volume support often leads to weak bounces or further declines.
- Poor timing: Not waiting for a candle close above/below VWAP increases your risk of false breakouts.
- Lack of exit plan: Failing to set profit targets or trailing stops makes it easy to let winners turn into losers.
If you’re new to these concepts, start by paper trading or using small position sizes until you’re comfortable executing live trades with real capital. The goal is consistency, not perfection.
Integrating VWAP Pullbacks with Other Crypto Trading Strategies
The best traders don’t rely solely on one indicator or strategy. Consider blending VWAP-based pullback tactics with other proven tools such as EMA crossovers, RSI divergences, or even elements from the popular 10ET trading strategy. This multi-factor approach helps confirm signals and reduces reliance on any single method, essential for surviving unpredictable crypto swings.
As market conditions evolve and assets like Bitcoin maintain levels above $110,000, adaptability remains key. Regularly review your performance data and tweak your approach as new patterns emerge in crypto price action. Engage with communities and follow experienced traders who share real-time insights about what’s working now versus what worked last year.
The bottom line? Mastering VWAP and time-based strategies takes practice but offers a powerful edge in today’s volatile crypto environment. For deeper dives into these techniques, and more actionable tips, visit our comprehensive guide: How to Use VWAP Pullback Strategies for Consistent Crypto Trading Profits.