The crypto market in November 2025 is a rollercoaster of volatility, with Bitcoin (BTC) currently at $89,538.00 after a sharp 5.93% dip in the last 24 hours, and Ethereum (ETH) at $2,985.79 following a 6.44% decline. For seasoned traders, these dramatic pullbacks aren’t just red candles – they’re opportunities to profit from percentage drop differences using advanced strategies that go far beyond simple dip buying. Let’s dive into the cutting-edge techniques top traders are leveraging to ride out the storm and turn panic into profit.
Bitcoin Live Price
Powered by TradingView
Trade BTC
Cross-Asset Percentage Drop Arbitrage: Exploiting Disproportionate Dips
When the market tanks, not all coins fall equally. Cross-Asset Percentage Drop Arbitrage is about scanning correlated assets – think BTC vs. ETH or sector tokens like DeFi coins – across multiple exchanges to spot which have dropped more than their peers. If Bitcoin plunges 6% but a closely linked token like SUI or Hedera nosedives 10%, that discrepancy often corrects as sentiment stabilizes.
The play? Enter positions in the assets with outsized drops, anticipating mean reversion as correlations snap back. This method requires lightning-fast data feeds and execution across several platforms but can yield outsized returns when panic selling creates temporary mispricings.
Dynamic Dip Buying with Volume Confirmation: Separating Panic from Correction
Not every dip is worth catching – some are slow bleed-outs, while others are true capitulations ripe for reversal. That’s where Dynamic Dip Buying with Volume Confirmation comes in. Instead of blindly buying every red candle, savvy traders use real-time volume analytics to confirm genuine capitulation.
The secret sauce? Only buy into percentage drops where selling volume spikes well above the 30-day average, signaling panic-driven overselling rather than orderly correction. This filters out false bottoms and helps you target entries where bounce potential is highest.
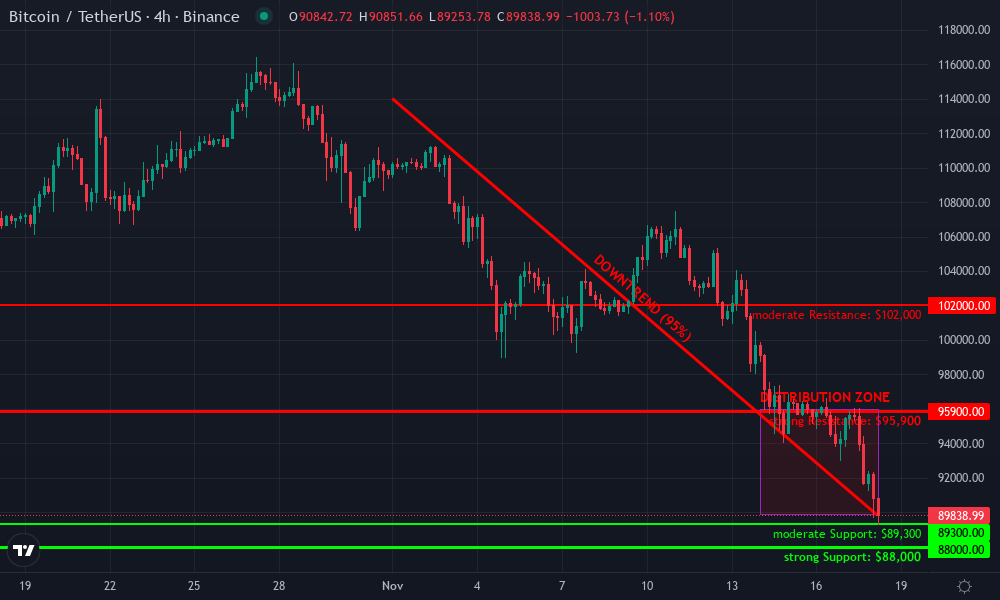
Bitcoin Technical Analysis Chart
Analysis by Julia McAllister | Symbol: BINANCE:BTCUSDT | Interval: 4h | Drawings: 6
Julia McAllister is a dynamic crypto trader and technical analyst with 7 years of experience in digital asset markets. Known for her aggressive swing trading strategies, she leverages advanced charting techniques to capture short-term opportunities. Julia’s motto: ‘Ride the volatility, manage the risk.’
technical-analysismarket-research
Julia McAllister’s Insights
This chart is a textbook aggressive short setup: persistent lower highs, increasing bearish momentum, and a fresh break below key psychological and structural support ($90,000 zone). With BTC at $89,538, the lack of bullish defense and recent sharp selloff signal that bears are firmly in control. I’m watching for a possible flush below $89,300—if that level cracks with volume, downside can accelerate toward $88,000 or even lower. However, given the sharpness of the move, late shorts are risky; I want to see a failed bounce or breakdown retest for optimal entry. If bulls reclaim $95,900, I’ll quickly flip bias to defense. High risk, high reward—classic volatility play.
Technical Analysis Summary
Draw a dominant downtrend line from the local peak around November 1st, 2025, near $114,000, extending through each successive lower high to the current price. Mark horizontal support at $89,300 (recent local low) and at $88,000 (psychological/round number level). Place horizontal resistance at $95,900 (recent 24h high and previous structure support). Use rectangles to highlight the latest sharp drop and the preceding consolidation zone (~$94,000-$96,000). Annotate volume spikes and MACD bearish crossovers if visible. Suggest aggressive short entries on breakdown confirmation and note potential reversal zones below $89,000 with tight stops.
Risk Assessment : high
Analysis : Market is in a strong downtrend with heightened volatility and aggressive momentum.Short setups offer high reward but also high risk of sharp reversals , especially after extended selloffs.Late shorts are vulnerable to short squeezes.
Julia McAllister ‘s Recommendation : Trade aggressively , but only on breakdown retests or failed bounces with strict stops.Watch for potential exhaustion and reversal candles below $89 ,000.Be nimble — quick to take profit or cut losses if invalidated.
Key Support & Resistance Levels
📈 Support Levels :
$89 ,300 – Most recent local low ; if breached , opens door for further downside.moderate
$88 ,000 – Psychological round number and next visible price shelf.strong
📉 Resistance Levels :
$95 ,900 – Recent h high and former support , now flipped to resistance.strong
$102 ,000 – Prior breakdown area , distant but relevant on strong bounce.moderate
Trading Zones (high risk tolerance)
🎯 Entry Zones:
$89,250 – Aggressive short entry on breakdown of support with high momentum.high risk
$96,000 – Aggressive long scalp if price reclaims and holds above resistance.high risk
🚪 Exit Zones:
$88,000 – Take profit for shorts at next psychological support.💰 profit target
$90,200 – Tight stop-loss for shorts above minor bounce highs.🛡️ stop loss
Technical Indicators Analysis 📊 Volume Analysis :Pattern : Volume spikes typically coincide with breakdown candles , confirming momentum.Look for volume confirmation on breakdowns or failed bounces to validate entries.
📈 MACD Analysis :Signal : Bearish crossovers likely;m omentum remains negative.MACD likely shows bearish momentum with no sign of reversal yet.
Applied TradingView Drawing Utilities This chart analysis utilizes the following professional drawing tools :Trend Line Horizontal Line Rectangle Arrow Marker Text Callout
Disclaimer : This technical analysis by Julia McAllister is for educational purposes only and should not be considered as financial advice.Trading involves risk , and you should always do your own research before making investment decisions.Past performance does not guarantee future results.The analysis reflects the author’s personal methodology and risk tolerance (high).
Fee-Optimized Scalping on Flash Crash Recoveries
The crypto markets love a good flash crash – those sudden plunges that trigger cascading liquidations before snapping back violently. Fee-Optimized Scalping on Flash Crash Recoveries is all about capitalizing on these whiplash moves by placing limit orders just above historically significant support levels during market-wide drops.
Your edge here isn’t just timing or technicals – it’s optimizing for exchange fees and liquidity. By prioritizing platforms with rock-bottom trading costs and deep order books, you maximize net gains from small-percentage rebounds that can add up quickly over multiple trades.
Cryptocurrency 6-Month Price Comparison (BTC, ETH & Top Altcoins)
Real-time price performance of major cryptocurrencies over the past 6 months (as of 2025-11-18)
Asset
Current Price
6 Months Ago
Price Change
Bitcoin
$89,717.00
$65,000.00
+38.0%
Ethereum
$2,997.37
$2,500.00
+19.9%
Binance Coin
$904.24
$700.00
+29.2%
Solana
$135.99
$100.00
+36.0%
Cardano
$0.4600
$0.3500
+31.4%
XRP
$2.14
$1.50
+42.7%
Dogecoin
$0.1538
$0.1200
+28.1%
Avalanche
$14.40
$10.00
+44.0%
Analysis Summary
Over the past six months, all major cryptocurrencies have experienced substantial price increases, with Avalanche (+44.0%) and XRP (+42.7%) leading the gains. Bitcoin has risen by 38.0%, while Ethereum posted a 19.9% increase. This broad-based growth reflects strong market sentiment and increased investor confidence heading into 2025.
Key Insights
Avalanche and XRP outperformed other major assets, each gaining over 40% in six months.
Bitcoin’s 38.0% rise demonstrates continued dominance and investor interest.
Ethereum’s growth (+19.9%) lagged behind Bitcoin and several top altcoins, but still delivered a strong performance.
All listed assets posted double-digit percentage gains, highlighting a robust and bullish crypto market environment.
All prices and percentage changes are sourced directly from the provided real-time market data as of November 18, 2025. The table compares current prices to those from exactly six months prior, calculating the percentage change for each asset.
Data Sources:
Main Asset: https://www.coingecko.com/en/coins/bitcoin
Disclaimer: Cryptocurrency prices are highly volatile and subject to market fluctuations. The data presented is for informational purposes only and should not be considered as investment advice. Always do your own research before making investment decisions.
Advanced Strategy Performance: What Do the Numbers Say?
This isn’t theory – backtesting shows these approaches can outperform traditional buy-and-hold strategies when paired with disciplined risk management (like risking only 1-2% of capital per trade). In fact, using dynamic allocation bots and real-time analytics has become the norm among pros seeking to consistently profit from chaotic markets.
Bitcoin is expected to recover and grow steadily post-2025 dip, with average prices potentially reaching $169,000 by 2031. While short-term volatility remains high, long-term prospects are positive due to increasing institutional adoption, advanced trading strategies, and ongoing technological improvements. Minimum and maximum scenarios reflect both regulatory headwinds and bullish adoption cycles.
Key Factors Affecting Bitcoin Price
Institutional adoption and ETF inflows
Advancements in AI-driven trading and risk management
Regulatory developments in the US, Europe, and Asia
Bitcoin halving cycles and fixed supply dynamics
Integration into mainstream financial systems
Competition from Ethereum and other Layer 1 blockchains
Macroeconomic trends such as inflation and global liquidity
Disclaimer: Cryptocurrency price predictions are speculative and based on current market analysis.
Actual prices may vary significantly due to market volatility, regulatory changes, and other factors.
Always do your own research before making investment decisions.
If you want to trade dips like a pro in 2025, you can’t just rely on gut instinct or old-school methods. The game has changed, and the next two strategies are where the real edge lies for those looking to profit from percentage drop differences in today’s lightning-fast markets.
Automated Risk-Adjusted Dip Allocation: Let Bots Manage Your Downside
Manual dip buying is yesterday’s news. The sharpest traders now deploy Automated Risk-Adjusted Dip Allocation: algorithmic bots that dynamically size positions based on the depth and velocity of price drops. Here’s how it works: when Bitcoin plunges from $95,914.00 to $89,538.00 in a day, your bot instantly analyzes the move, compares it to historical volatility bands, and allocates capital according to strict risk parameters, typically risking just 1-2% of your stack per trade.
This approach protects you from overexposure during freefalls while still letting you scale up when the odds are stacked in your favor. With automated systems, you’re not glued to the screen or second-guessing entries; your rules execute with machine precision even as markets move at warp speed.
On-Chain Sentiment Divergence Analysis: Finding Hidden Reversals Before the Herd
The final frontier for advanced dip trading? On-Chain Sentiment Divergence Analysis. This method goes beyond charts and order books by integrating blockchain data, think wallet inflows/outflows, whale transactions, and network activity, to spot assets experiencing sharp price drops despite positive on-chain fundamentals.
For example, if Ethereum tumbles 6.44% to $2,985.79 but on-chain data shows a surge in long-term holder accumulation and exchange outflows (meaning coins are being locked away rather than dumped), that’s your cue for a high-conviction entry. These divergences often precede powerful recoveries as technical selling exhausts itself while fundamentals remain strong.
Putting It All Together: Profiting From Chaos
The beauty of these advanced techniques is their synergy, by combining cross-asset arbitrage, volume-confirmed dip buying, fee-savvy scalping, automated allocation, and on-chain divergence analysis, you build a robust playbook for any market storm. In 2025’s hyper-connected landscape, speed and data-driven discipline are non-negotiable if you want to consistently profit from crypto dips.
Avoid FOMO: Only act when your signals align across multiple strategies.
Use automation: Let bots handle execution so emotion doesn’t sabotage your game plan.
Track fees and slippage: Every basis point counts when scalping rebounds or arbitraging drops.
Diversify exposure: Don’t bet it all on one coin or sector, spread risk across correlated assets with disproportionate dips.
Monitor fundamentals: Let on-chain trends guide your conviction during chaotic selloffs.
Which advanced crypto dip strategy will you focus on for 2025?
With Bitcoin currently at $89,538 (down 5.93% in 24h) and Ethereum at $2,985.79 (down 6.44%), the market is highly volatile. Advanced dip strategies can help you profit from these sharp moves. Which approach are you most interested in using?
The volatility isn’t going anywhere, if anything, it’s accelerating as more capital floods into digital assets. By mastering these advanced strategies for profiting from percentage drop differences, you can turn every market panic into an opportunity for outsized gains while keeping risk under tight control. Want more actionable tactics for navigating turbulent markets? Check out our specialized guide on trading crypto during stock market drops.
Julia McAllister is a dynamic crypto trader and technical analyst with 7 years of experience in digital asset markets. Known for her aggressive swing trading strategies, she leverages advanced charting techniques to capture short-term opportunities. Julia's motto: 'Ride the volatility, manage the risk.'