Candlestick patterns have long been a cornerstone of technical analysis, but in the fast-moving world of crypto stock trading, their importance has only grown. As we head deeper into 2024, understanding these visual signals is essential for anyone seeking an edge in volatile markets. Whether you’re a beginner looking to decode your first chart or a seasoned trader refining your strategy, mastering candlestick patterns can help you spot emerging trends, time entries and exits, and manage risk more effectively.

Why Candlestick Patterns Matter in Crypto Stock Trading
The crypto market’s 24/7 nature and notorious price swings make it a playground for technical traders. Candlestick patterns offer a time-tested way to interpret market psychology at a glance. Each candle captures the battle between buyers and sellers over a set period, revealing shifts in momentum that can precede major moves. In 2024, as algorithmic trading and AI-driven analysis become more prevalent, these patterns remain a vital tool for human traders seeking to understand the story behind the price action.
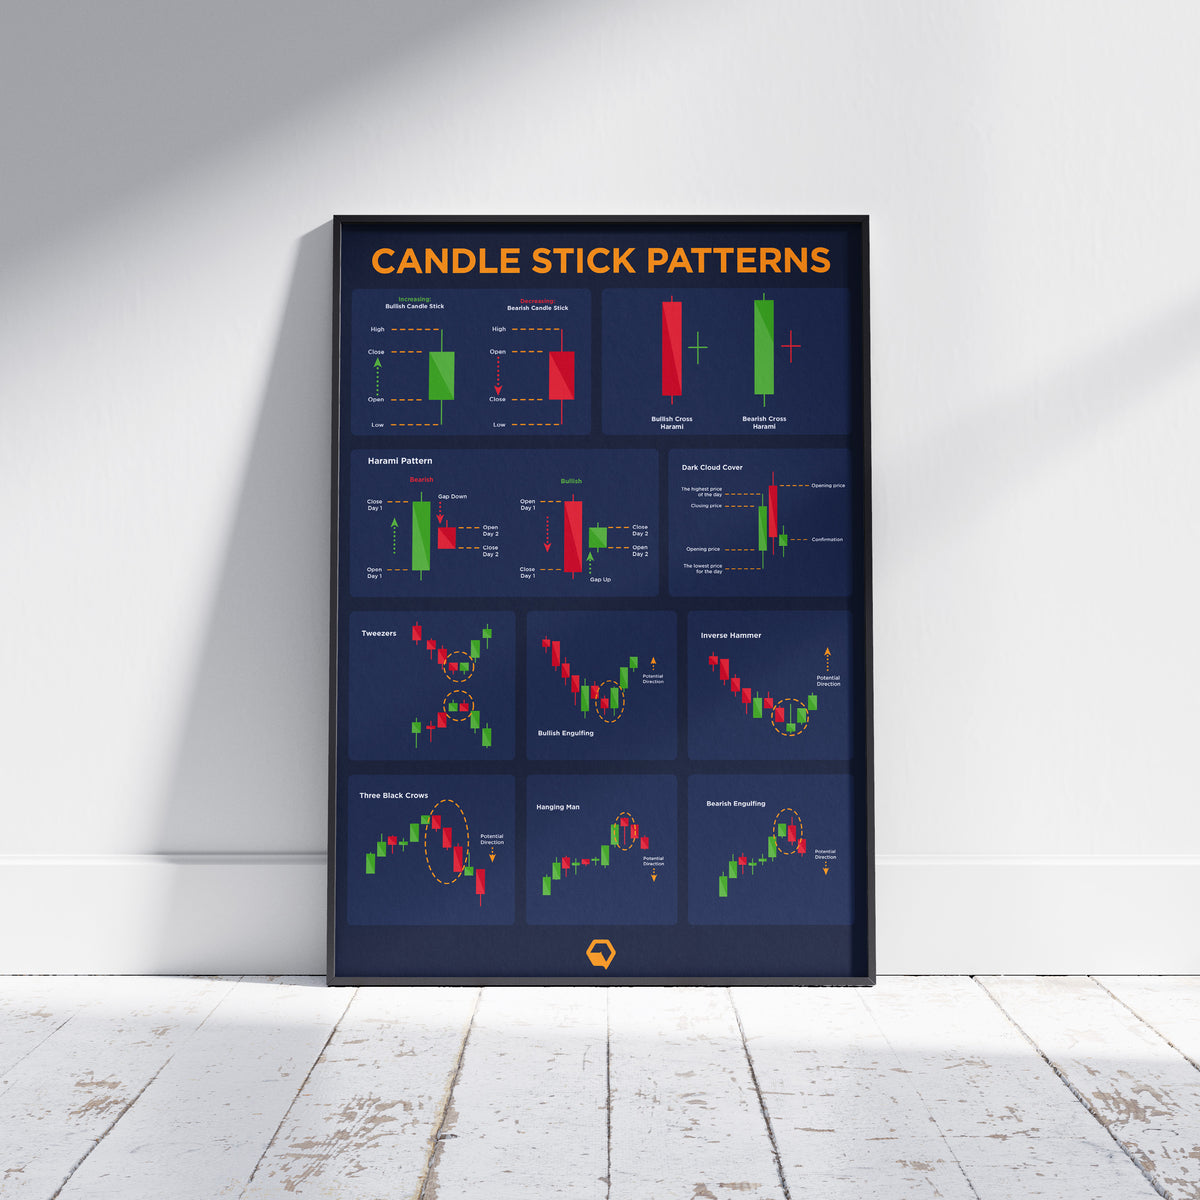
Among dozens of known formations, seven patterns stand out for their proven reliability and popularity among crypto traders:
7 Key Candlestick Patterns for Crypto Trading (2024)
-
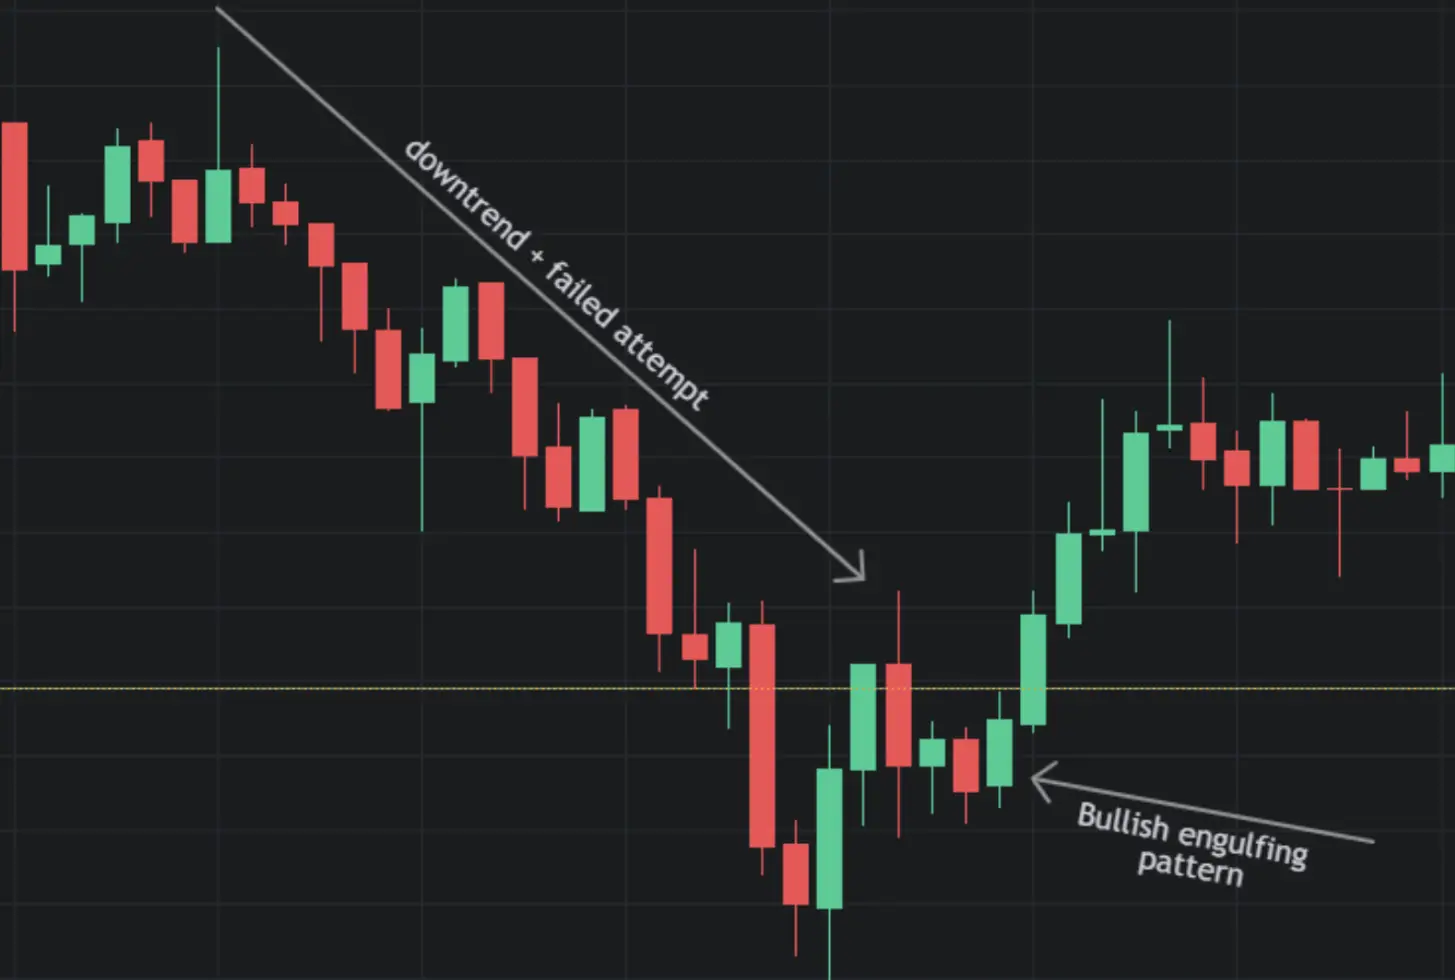
Bullish Engulfing Pattern: This pattern features a small bearish (red) candle followed by a larger bullish (green) candle that completely engulfs the previous candle’s body. It signals a potential reversal from a downtrend to an uptrend, indicating strong buying pressure. Widely used by traders to spot bullish momentum shifts.
-
Bearish Engulfing Pattern: Characterized by a small bullish (green) candle followed by a larger bearish (red) candle that engulfs the previous candle’s body. This pattern suggests a reversal from an uptrend to a downtrend, highlighting strong selling pressure and often signaling the start of a bearish phase.
-
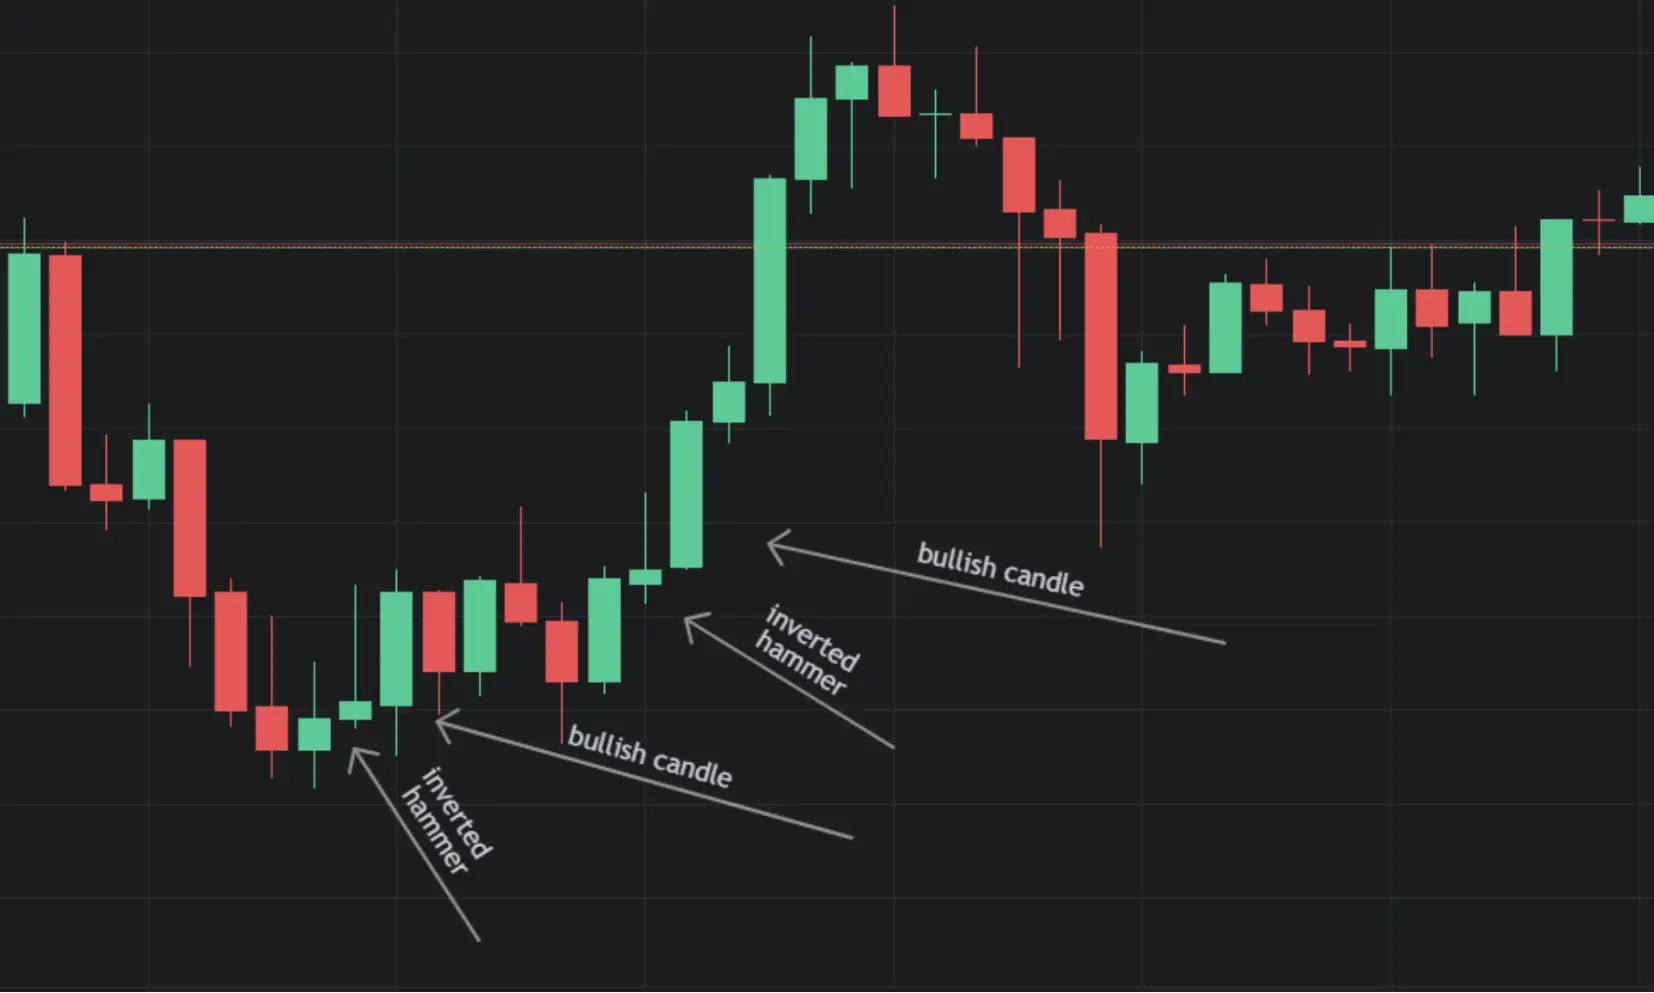
Hammer: A single candle with a small body at the top and a long lower wick, resembling a hammer. It appears after a downtrend and signals a potential bullish reversal as buyers push the price back up from session lows.
-
Doji: A candle where the opening and closing prices are nearly equal, creating a cross or plus sign shape. The Doji indicates market indecision and often precedes major price moves, making it crucial for traders watching for trend reversals.
-
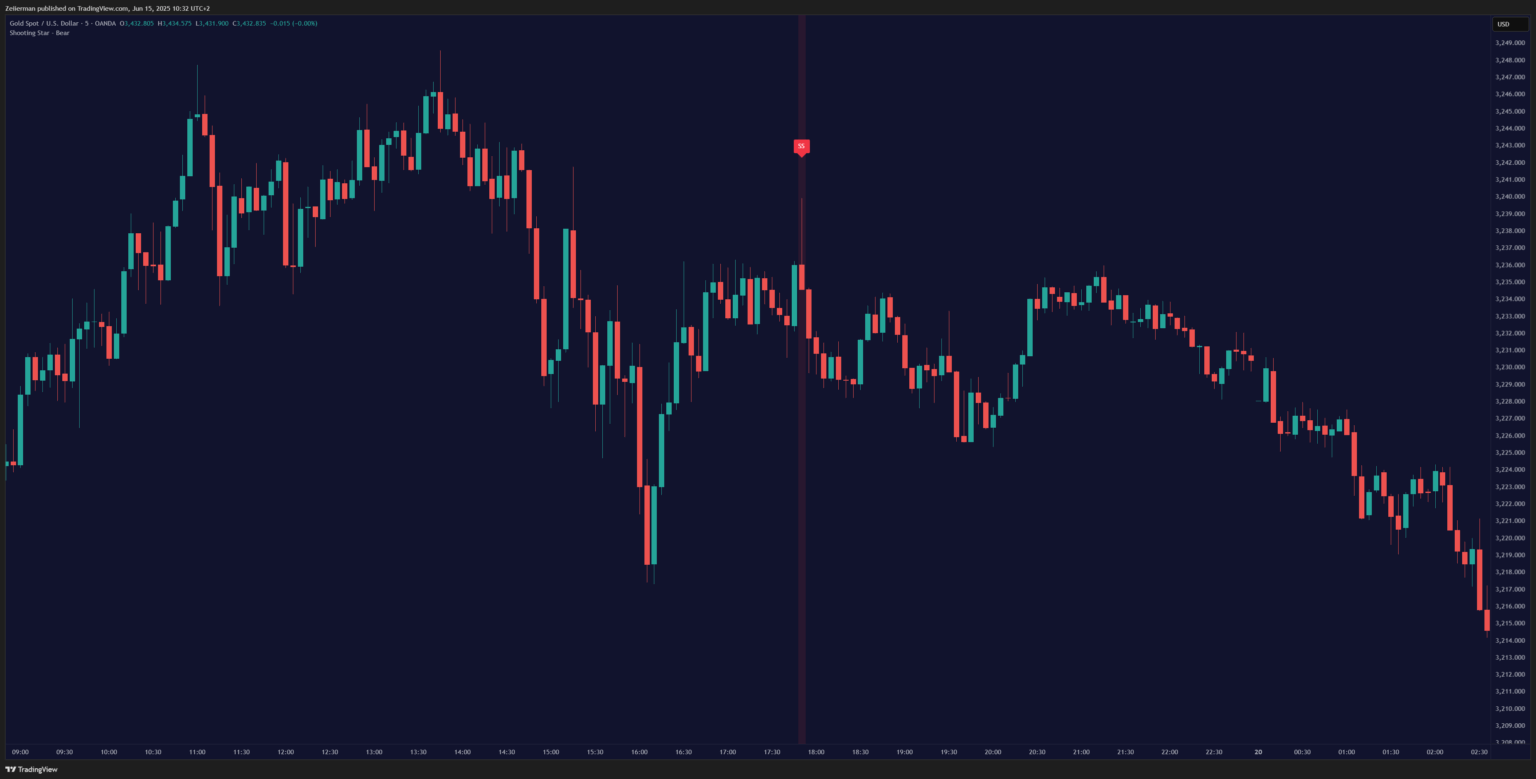
Shooting Star: Featuring a small body at the bottom with a long upper wick, the Shooting Star forms after an uptrend and signals a potential bearish reversal. It shows that buyers tried to push prices higher but sellers regained control.
-
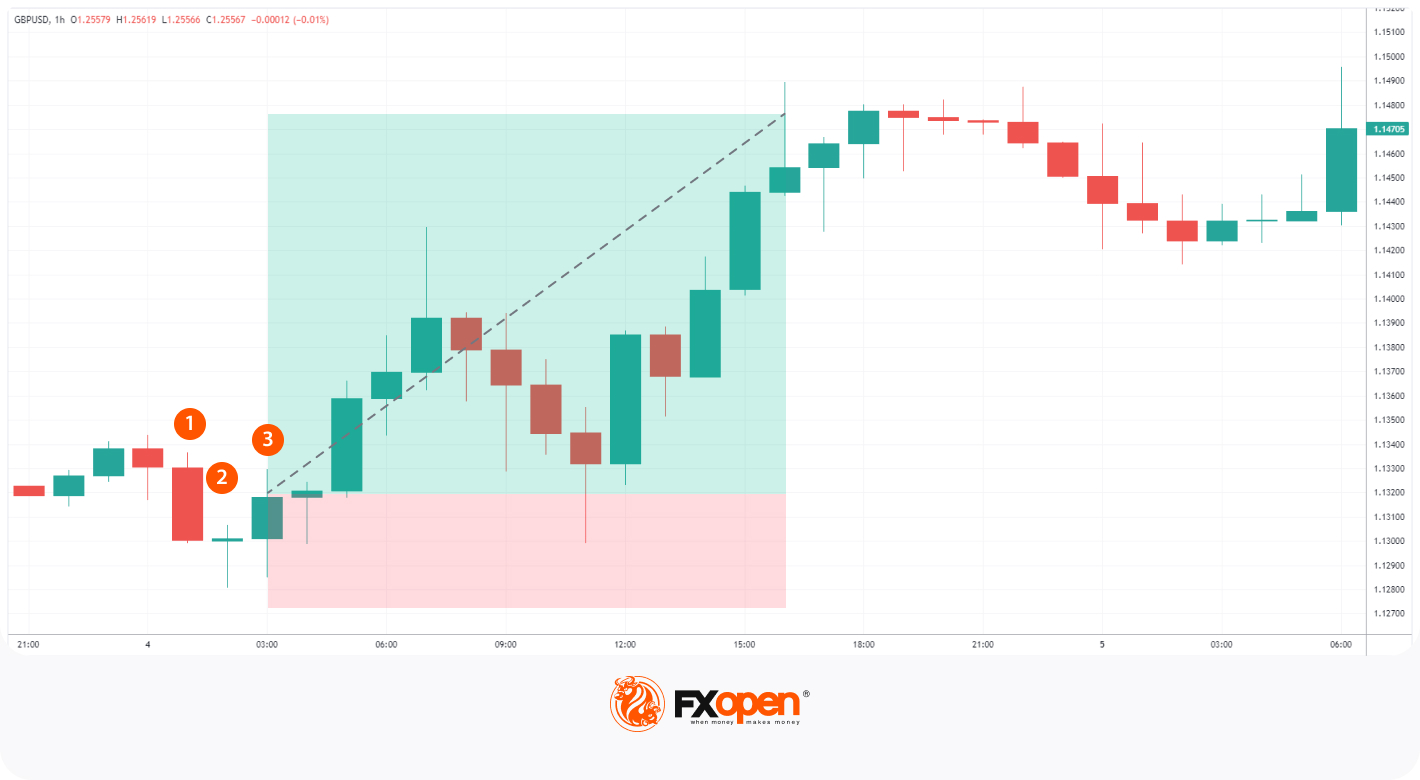
Morning Star: This three-candle pattern consists of a long bearish candle, a small-bodied candle (bullish or bearish), and a long bullish candle. The Morning Star signals a reversal from a downtrend to an uptrend, indicating a shift from selling to buying pressure.
-
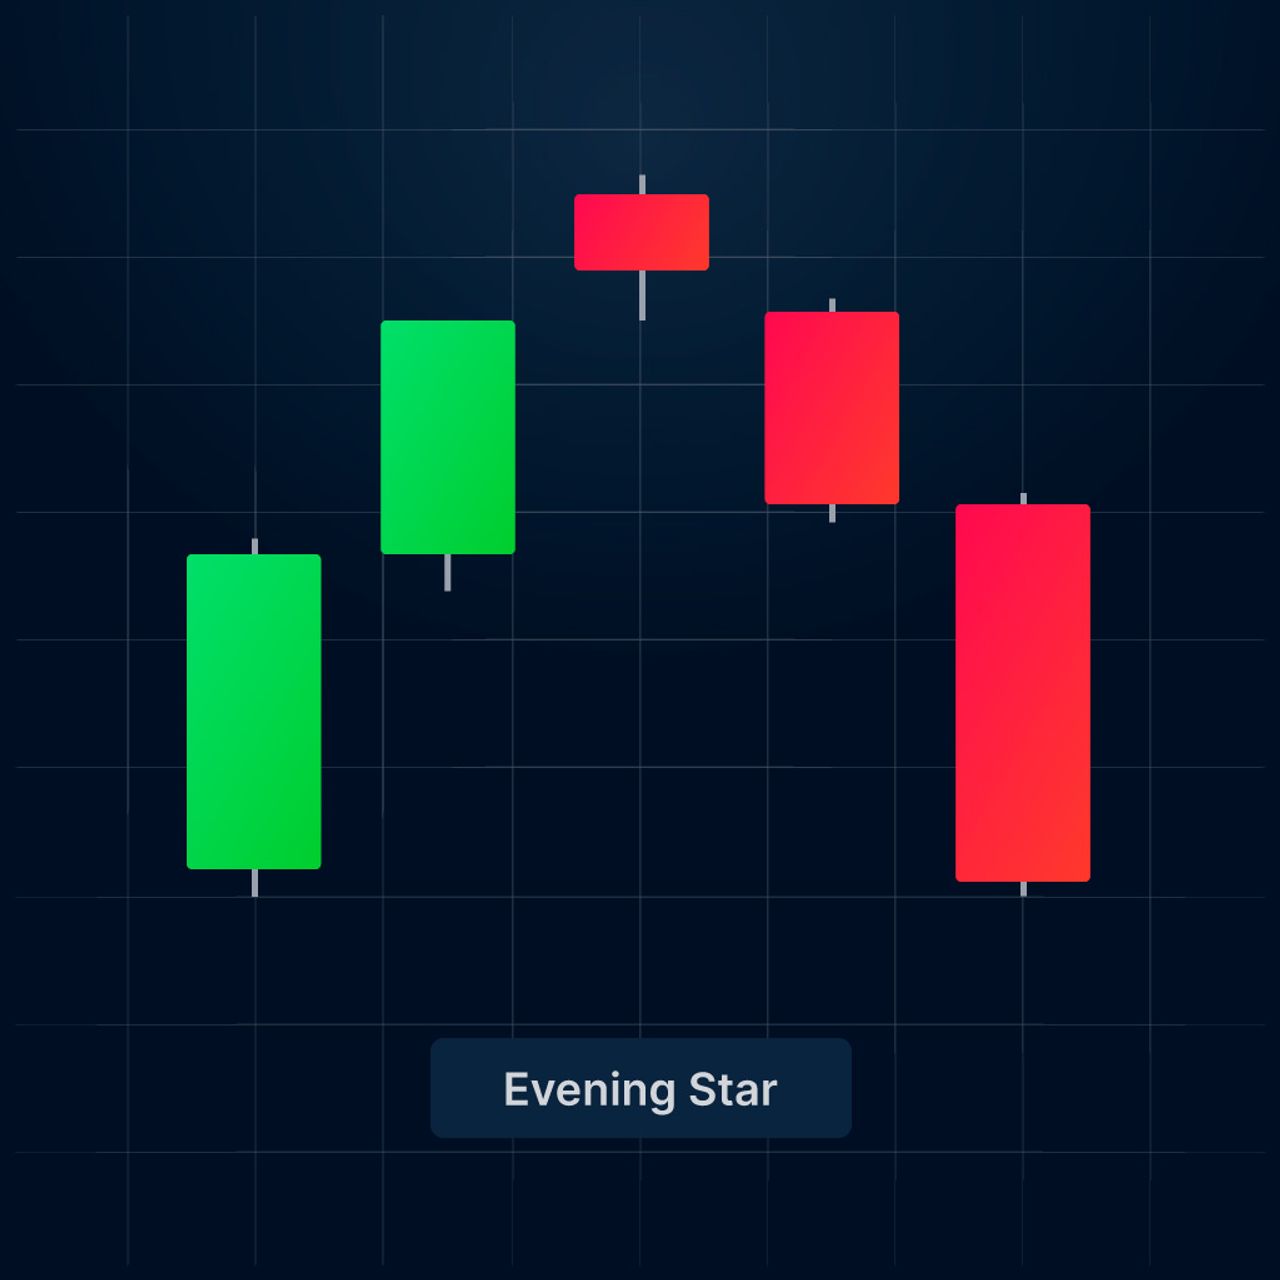
Evening Star: The opposite of the Morning Star, this pattern includes a long bullish candle, a small-bodied candle, and a long bearish candle. The Evening Star indicates a reversal from an uptrend to a downtrend, warning traders of potential bearish momentum.
The 7 Most Effective Candlestick Patterns for 2024
Let’s break down each pattern and explore how you can use them to make smarter trading decisions:
1. Bullish Engulfing Pattern
This two-candle formation signals a potential reversal from bearish to bullish momentum. The first candle is red (bearish), followed by a larger green (bullish) candle that completely engulfs the previous body. In crypto trading, a Bullish Engulfing Pattern often appears at the end of a downtrend and suggests strong buyer interest. For example, if Bitcoin forms this pattern after a sharp drop, it may foreshadow a rally. Always look for increased volume to confirm the signal.
2. Bearish Engulfing Pattern
Flipping the script, the Bearish Engulfing Pattern is a classic sign of a potential trend reversal from bullish to bearish. Here, a small green candle is followed by a larger red candle that swallows it whole. This pattern is especially significant at local highs or after extended rallies. In 2024’s unpredictable markets, catching this reversal early can help you avoid getting caught in sharp sell-offs.
3. Hammer
The Hammer is a single-candle pattern that stands out with its small body at the top and a long lower wick. It appears after a decline and indicates that sellers pushed prices down, but buyers fought back to close near the open. This pattern is a favorite among crypto traders watching for bottoming signals, especially when combined with strong support levels or a surge in trading volume.
4. Doji
Doji candles have nearly equal open and close prices, creating a cross or plus sign shape. They represent indecision in the market: neither buyers nor sellers are in control. In crypto stock trading, a Doji can foreshadow a reversal or mark a period of consolidation before a breakout. For deeper insights on Doji and other essential patterns, check out Morpher’s updated guide.
Using Candlestick Patterns to Anticipate Crypto Market Moves
Recognizing these patterns is just the start, context is everything. Here are some practical tips for integrating candlestick analysis into your crypto stock trading strategy:
- Confirmation: Don’t trade on a single pattern alone. Wait for confirmation from subsequent candles or other indicators before entering a position.
- Volume Analysis: Patterns accompanied by high trading volume are more likely to signal genuine reversals or continuations.
- Combine Tools: Use candlestick patterns alongside moving averages or RSI to filter out false signals and improve your win rate.
- Risk Management: Always set stop-loss orders to protect against unexpected volatility, especially critical in crypto markets.
Stay tuned as we dive deeper into Shooting Star, Morning Star, and Evening Star patterns, their unique structures, what they reveal about market sentiment, and how to use them for actionable trade setups in 2024’s dynamic crypto landscape.
5. Shooting Star
The Shooting Star is a single-candle pattern that emerges after a price rally. It’s characterized by a small body near the session’s low and a long upper wick, showing that buyers pushed prices higher but were ultimately overpowered by sellers. In crypto stock trading, the Shooting Star is a warning sign that bullish momentum is fading. If you spot this pattern on a coin like Ethereum after a strong run, it’s often a cue to tighten stops or consider taking profits, especially if confirmed by a subsequent bearish candle or declining volume.
6. Morning Star
The Morning Star is a powerful three-candle reversal pattern that typically signals the end of a downtrend. It starts with a long bearish candle, followed by a small-bodied candle (the “star”) that gaps down, and finishes with a strong bullish candle. This sequence reflects a tug-of-war: sellers dominate, then indecision, then buyers take control. In 2024’s crypto markets, the Morning Star can be an early indicator of trend shifts on assets like Solana or Bitcoin. For best results, look for this pattern at established support zones and pair it with rising volume as confirmation.
7. Evening Star
As the bearish counterpart to the Morning Star, the Evening Star signals a potential top after a sustained uptrend. The pattern begins with a long bullish candle, followed by a small-bodied candle (which may gap up), and concludes with a strong bearish candle. This formation tells you that buyers are losing steam and sellers are stepping in. In highly volatile crypto stocks, catching an Evening Star at resistance can help you exit before sharp declines or even take advantage of short opportunities.
Integrating Candlestick Patterns Into Your 2024 Crypto Trading Strategy
Identifying these seven candlestick patterns is only half the battle – the real skill lies in interpreting them within the broader market context. Here’s how top crypto traders are leveraging these signals in 2024:
- Multi-timeframe Analysis: Spotting a Bullish Engulfing Pattern on the daily chart? Check the 4-hour and weekly charts for confirmation before acting.
- Volume as Validation: A Hammer pattern backed by a surge in trading volume is far more trustworthy than one on light volume. Volume confirms conviction.
- Combining Indicators: Pair patterns like Doji or Shooting Star with RSI divergence or moving average crossovers to filter out noise and boost accuracy.
- Adaptive Risk Controls: Use stop-losses just below the low of a Hammer or above the high of a Shooting Star to protect your capital if the signal fails.
Recent research has also highlighted the emergence of new patterns and analytical frameworks, such as high-frequency candlestick data to enhance prediction models (see this study). But for most traders, mastering these seven core patterns remains the foundation of effective technical analysis in crypto stock trading.
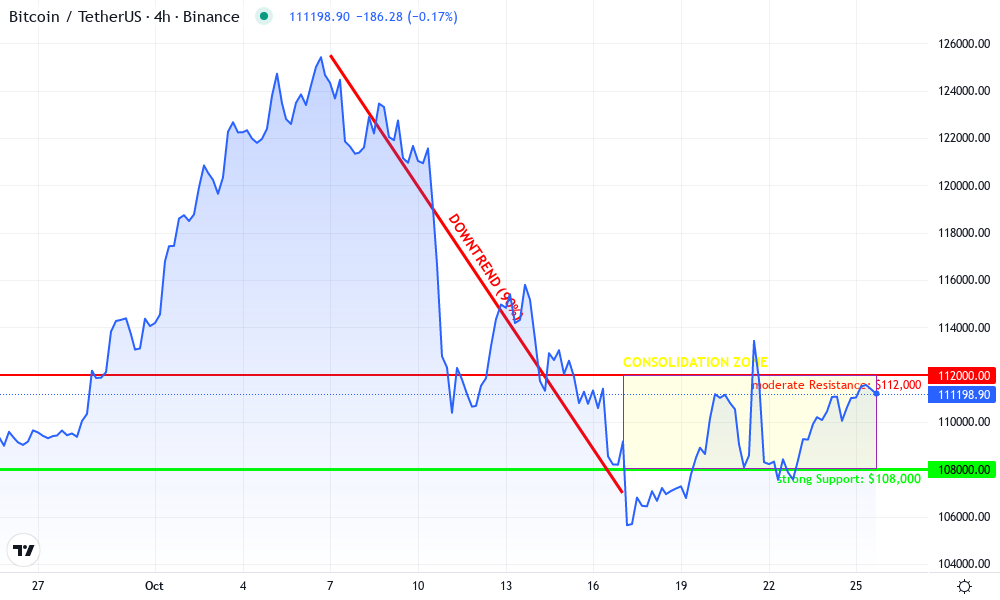
Bitcoin Technical Analysis Chart
Analysis by Samantha Leighton | Symbol: BINANCE:BTCUSDT | Interval: 1D | Drawings: 4
Technical Analysis Summary
Draw a major downtrend line starting from the local peak near $125,500 (around October 7, 2025) down to the recent lows below $107,000 (around October 17, 2025). Mark horizontal support at $108,000 and resistance at $112,000. Highlight the consolidation range between $108,000 and $112,000 for the second half of October 2025. Use rectangles to show accumulation near the $108,000-$109,000 zone. Add an arrow marker at the sharp V-shaped recovery on October 17, 2025. Annotate the chart with text/callouts for the major breakdown (October 10-11, 2025) and the failed recovery spikes.
Risk Assessment: medium
Analysis: The market is in transition after a significant correction. While the downside appears somewhat contained by recent support, upside is capped by resistance and lack of clear bullish momentum. A breakout from the current range will offer better clarity.
Samantha Leighton’s Recommendation: Stay patient and avoid overtrading in the chop. Look for confirmation of a range breakout before committing size. Keep risk defined below $108,000 and consider partial profits near resistance until a new trend emerges.
Key Support & Resistance Levels
📈 Support Levels:
-
$108,000 – Major support established after the sharp correction; tested multiple times
strong
📉 Resistance Levels:
-
$112,000 – Upper bound of current consolidation; price rejected here several times
moderate -
$116,000 – Interim resistance from failed recovery; marks a pivot before latest drop
weak
Trading Zones (medium risk tolerance)
🎯 Entry Zones:
-
$108,500 – Potential long entries on confirmed support bounce within accumulation zone
medium risk
🚪 Exit Zones:
-
$112,000 – First take-profit zone on range play; resistance cap
💰 profit target -
$107,000 – Protective stop below key support to prevent major downside loss
🛡️ stop loss
Technical Indicators Analysis
📊 Volume Analysis:
Pattern: Volume spikes likely accompanied the sharp breakdown and recovery, confirming high conviction in those moves.
Watch for increased volume on any breakout above $112,000 or breakdown below $108,000 for confirmation.
📈 MACD Analysis:
Signal: Likely neutral to slightly bullish divergence developing after recent lows.
Monitor for MACD crossover as confirmation for a new trend direction out of consolidation.
Applied TradingView Drawing Utilities
This chart analysis utilizes the following professional drawing tools:
Disclaimer: This technical analysis by Samantha Leighton is for educational purposes only and should not be considered as financial advice.
Trading involves risk, and you should always do your own research before making investment decisions.
Past performance does not guarantee future results. The analysis reflects the author’s personal methodology and risk tolerance (medium).
Key Takeaways for Crypto Stock Traders
While no single pattern guarantees success, consistently applying these seven candlestick formations – Bullish Engulfing Pattern, Bearish Engulfing Pattern, Hammer, Doji, Shooting Star, Morning Star, and Evening Star – gives you a proven framework for navigating crypto’s volatility. Practice reading these signals in real time, combine them with robust risk management and other technical tools, and you’ll be better equipped to spot opportunities and avoid traps in 2024’s fast-paced crypto stock market.