
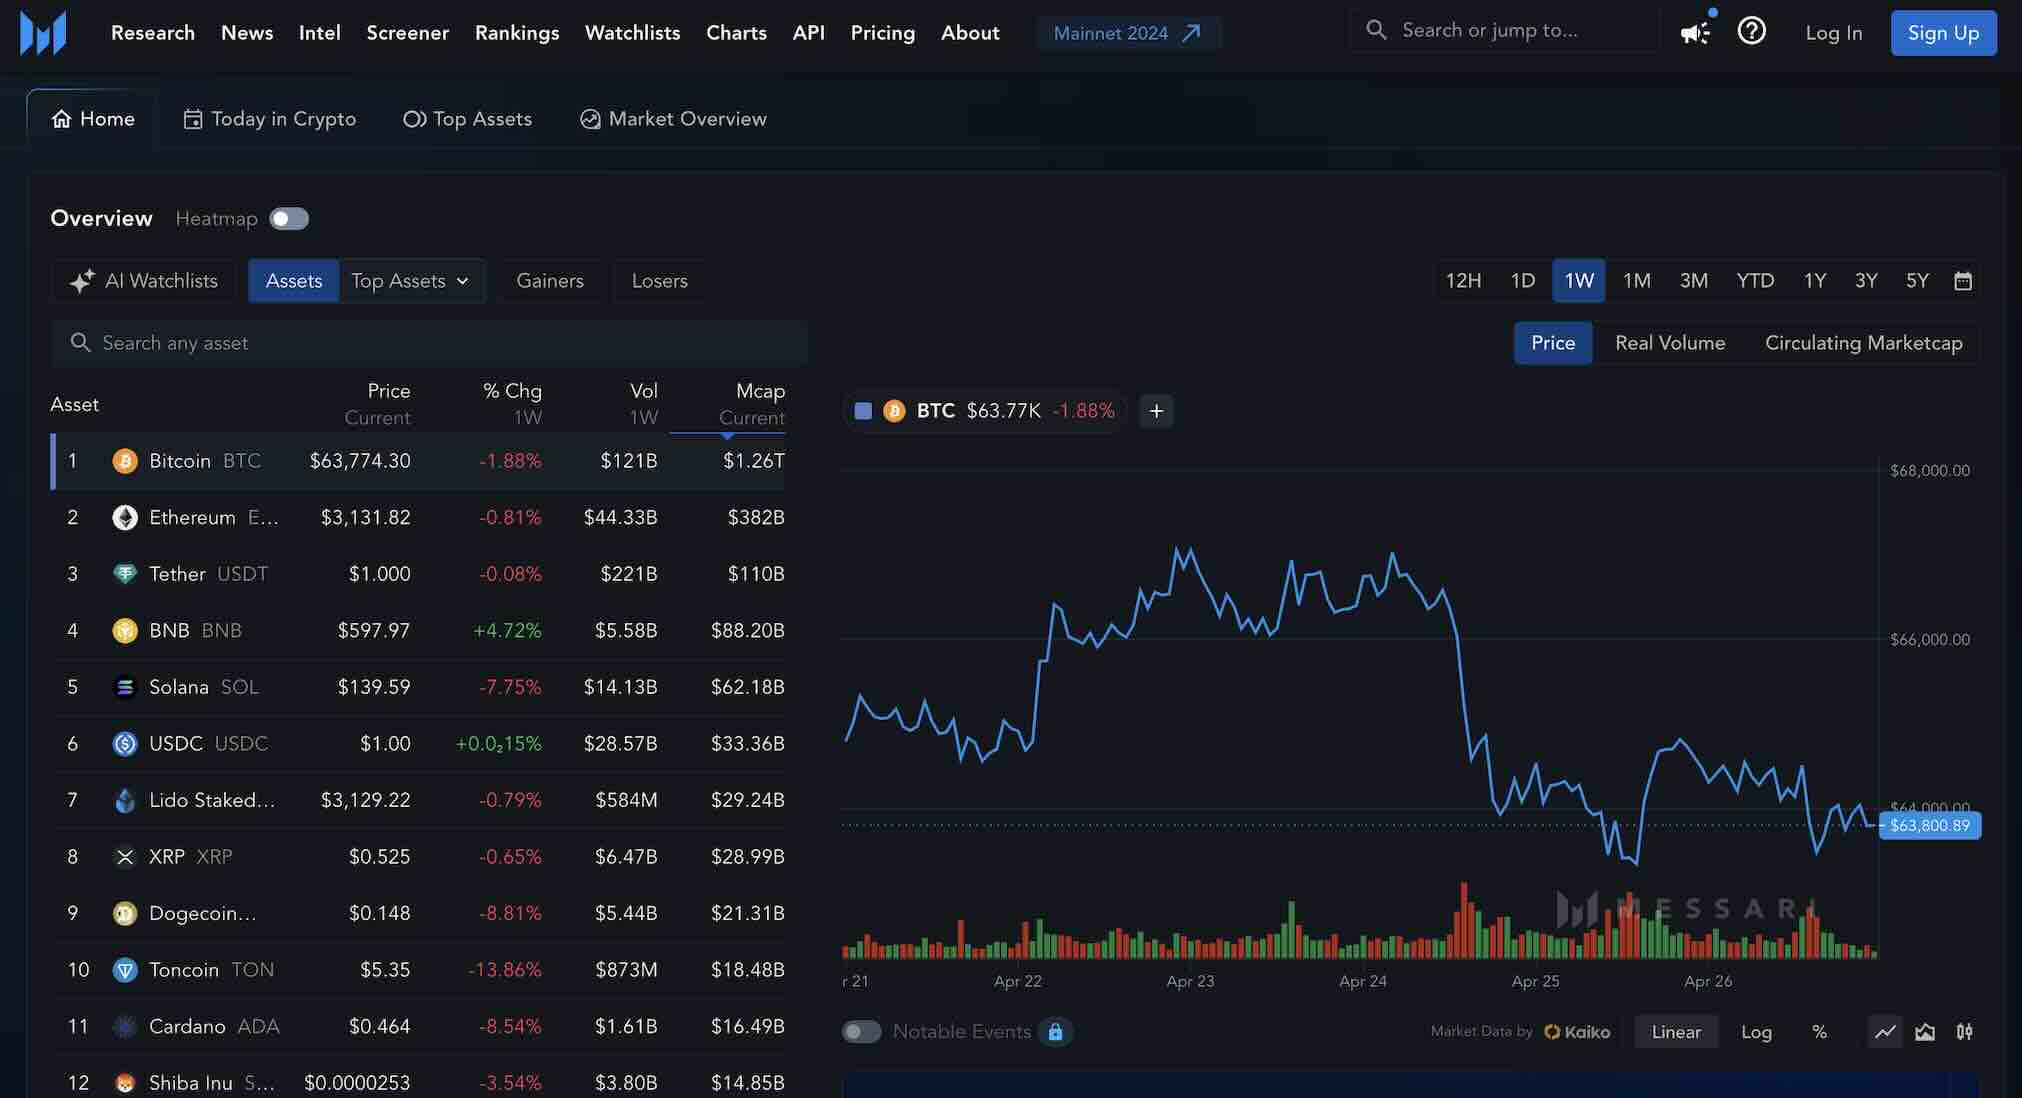
In the fast-evolving world of crypto stock trading, few events attract as much attention as the expiration of CME Bitcoin futures contracts. For traders navigating the intersection of traditional finance and digital assets, understanding how these expiries influence both Bitcoin and altcoin prices is essential. As of October 12,2025, Bitcoin (BTC) is trading at $113,939.00, reflecting a 1.68% increase over the last 24 hours. Ethereum (ETH) is also on the rise, sitting at $4,112.99 with a robust 7.69% gain.

CME Futures Expiry: Why Crypto Traders Watch Closely
The Chicago Mercantile Exchange (CME) has become a pivotal arena for institutional crypto exposure. CME futures contracts allow traders to speculate on the future price of Bitcoin without owning the underlying asset directly. These contracts have set expiration dates, typically occurring on the last Friday of each month.
As expiry approaches, several market dynamics come into play:
- Heightened Volatility: Position adjustments can trigger rapid price swings in both spot and derivatives markets.
- Sentiment Signals: The settlement outcome often reflects prevailing market sentiment – a majority of profitable long positions may embolden bulls, while dominant short settlements can stoke bearishness.
- Liquidity Shifts: Rolling over or closing positions can cause temporary imbalances in buying and selling pressure.
This confluence of factors makes CME expiry periods crucial for anyone involved in CME futures expiry crypto trading strategies.
How Bitcoin Futures Expiry Impacts Spot Prices at $113,939
A growing body of research supports the idea that CME futures expiry can impact Bitcoin’s spot price. As contracts settle – usually in cash – traders may engage in last-minute buying or selling to influence settlement prices or hedge their exposure. This activity often results in increased trading volumes and heightened volatility around expiry dates.
The current context illustrates this well: with Bitcoin holding above $113,000, even small shifts in sentiment or liquidity can create outsized effects due to leverage and market interconnectedness. Notably, altcoins frequently mirror these movements as capital flows shift across correlated assets.
Bitcoin Technical Analysis Chart
Analysis by Darren Kirkwood | Symbol: BINANCE:BTCUSDT | Interval: 1D | Drawings: 7
Technical Analysis Summary
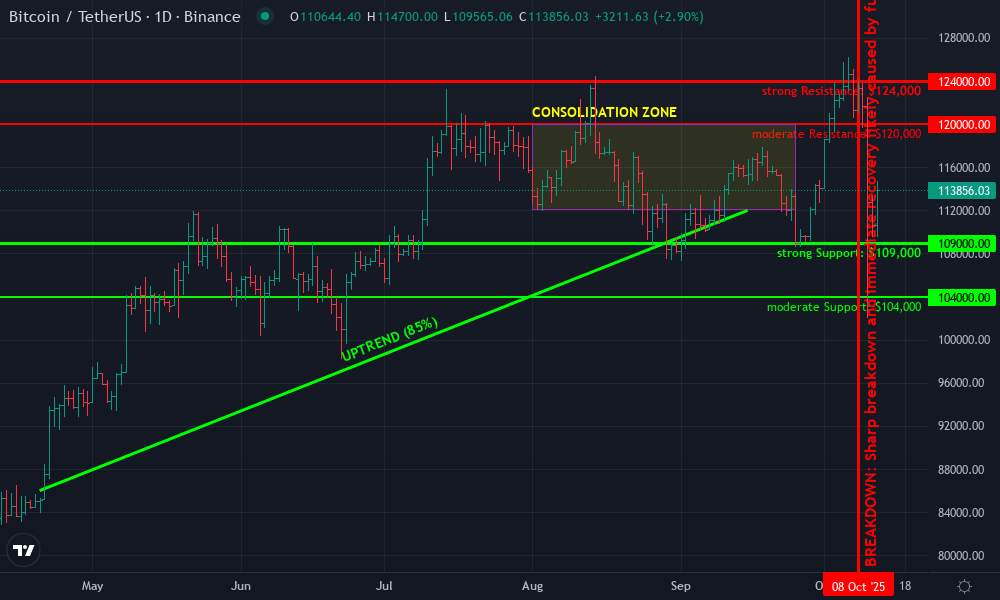
To accurately reflect the current market dynamics on the BTCUSDT daily chart, begin by plotting a long-term uptrend line from late April 2025’s swing low (around $86,000) to the recent higher lows in July and September at approximately $104,000 and $112,000, respectively. Add a horizontal resistance line at $124,000 and another at $120,000, marking the upper rejection points in October. Place a strong horizontal support at $109,000, which coincides with the recent rapid wick down and prior consolidation. Consider adding a secondary support at $104,000, referencing the July swing low. Mark the sharp price spike and immediate retracement in early October with a vertical line and a callout noting probable futures expiration volatility. Use rectangles to highlight the consolidation ranges between $112,000 and $120,000 (August-September), and between $104,000 and $112,000 (June-July). Use text/callouts to note the increased volatility on October futures expiration. Avoid aggressive upside projections; focus on risk-managed zones aligned with capital preservation.
Risk Assessment: medium
Analysis: The market remains structurally bullish, but volatility spikes around derivatives settlement introduce unpredictable risk. Strong support at $109,000 provides a reasonable risk buffer, but the speed of moves demands disciplined stop-losses. No aggressive positions are warranted until the market either confirms above $120,000 or retests $109,000 successfully.
Darren Kirkwood’s Recommendation: Wait for a stabilization above $120,000 for momentum longs, or accumulate cautiously if price consolidates above $109,000. Always employ tight risk controls—capital protection first.
Key Support & Resistance Levels
📈 Support Levels:
-
$109,000 – Strong support from recent volatility wick and prior consolidation
strong -
$104,000 – Secondary support from July swing low
moderate
📉 Resistance Levels:
-
$120,000 – Near-term resistance from repeated rejection in October
moderate -
$124,000 – Major resistance from October’s upper wick
strong
Trading Zones (low risk tolerance)
🎯 Entry Zones:
-
$109,000 – Test of strong support and potential post-futures expiry shakeout
low risk
🚪 Exit Zones:
-
$120,000 – Take profit at first resistance after entry at $109,000
💰 profit target -
$104,000 – Stop-loss below secondary support for risk management
🛡️ stop loss
Technical Indicators Analysis
📊 Volume Analysis:
Pattern: Significant spikes likely around major volatility events (such as the October wick)
Volume surges are anticipated during futures expiration/volatility spikes—mark these with callouts for heightened risk periods.
📈 MACD Analysis:
Signal: No direct MACD visible, but likely bearish cross in early October followed by potential reversal.
MACD would likely show a bearish crossover on the sharp sell-off, with a possible recovery signal on stabilization.
Applied TradingView Drawing Utilities
This chart analysis utilizes the following professional drawing tools:
Disclaimer: This technical analysis by Darren Kirkwood is for educational purposes only and should not be considered as financial advice.
Trading involves risk, and you should always do your own research before making investment decisions.
Past performance does not guarantee future results. The analysis reflects the author’s personal methodology and risk tolerance (low).
The Ripple Effect: Altcoin Price Volatility During CME Expiry Events
While Bitcoin remains the primary focus during CME futures expirations, altcoins are not immune to these market tremors. As traders rebalance portfolios or unwind leveraged positions tied to Bitcoin derivatives, capital often flows into or out of major altcoins like Ethereum – currently at $4,112.99. This creates secondary waves of volatility across the broader crypto landscape.
A study published by QuantPedia found that during critical futures expiration windows, both spot and derivative volumes surge not only for Bitcoin but also for high-cap altcoins. The effect is particularly pronounced when large numbers of contracts are set to expire during periods of elevated market uncertainty.
Bitcoin (BTC) Price Prediction 2026-2031 Post-CME Futures Expiry
Forecasts based on current market context, futures expiry impacts, and broader crypto market trends.
| Year | Minimum Price (Bearish Scenario) | Average Price (Base Case) | Maximum Price (Bullish Scenario) | Potential Annual % Change (Avg) | Key Market Scenario |
|---|---|---|---|---|---|
| 2026 | $89,000 | $128,000 | $170,000 | +12% | Mild post-halving rally, moderate volatility from CME expiries |
| 2027 | $105,000 | $146,000 | $210,000 | +14% | Continued institutional adoption, regulatory clarity improves sentiment |
| 2028 | $124,000 | $173,000 | $258,000 | +19% | Bull market peak, increased ETF inflows, futures-driven volatility |
| 2029 | $140,000 | $156,000 | $220,000 | -10% | Market correction phase after bull run, tighter regulations |
| 2030 | $122,000 | $178,000 | $265,000 | +14% | Renewed growth, new use cases, technological improvements |
| 2031 | $140,000 | $202,000 | $310,000 | +13% | Mainstream adoption, global macro factors drive demand |
Price Prediction Summary
Bitcoin is expected to experience moderate but steady growth over the next six years, with periods of heightened volatility often coinciding with CME futures expiries. While short-term corrections are possible, particularly after major bull runs, the long-term outlook remains positive due to increasing institutional involvement, technological advancements, and broader adoption. Predicted prices account for both bullish and bearish scenarios, with the average price rising from $128,000 in 2026 to $202,000 by 2031.
Key Factors Affecting Bitcoin Price
- CME futures expiry-induced volatility and liquidity shifts
- Global regulatory developments and potential ETF approvals
- Institutional adoption and macroeconomic environment
- Bitcoin halving cycles and supply dynamics
- Technological innovations and network upgrades
- Market sentiment and capital inflows/outflows
- Competition from altcoins and alternative investment vehicles
Disclaimer: Cryptocurrency price predictions are speculative and based on current market analysis.
Actual prices may vary significantly due to market volatility, regulatory changes, and other factors.
Always do your own research before making investment decisions.
Navigating Crypto Trading Strategies Around Futures Expiry
Savvy traders adopt specific strategies during these periods to manage risk and capitalize on volatility spikes:
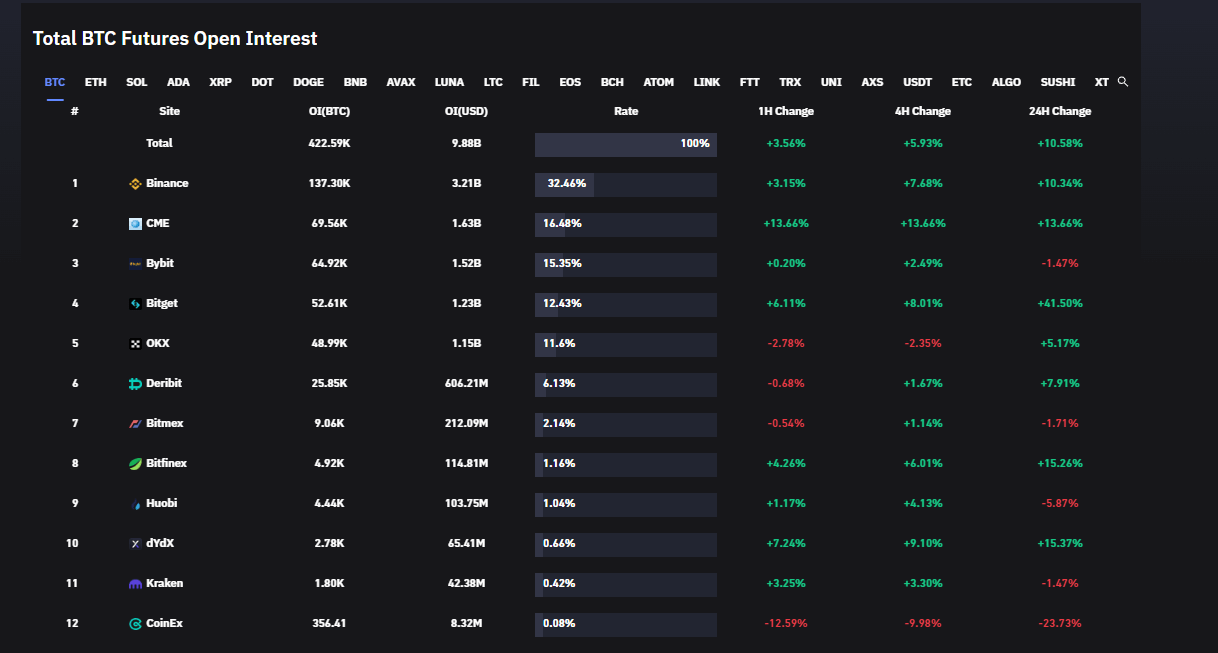
- Monitor Open Interest: Track outstanding contract size for clues about potential directional moves.
- Diversify Exposure: Avoid over-concentration in assets most affected by expiry-driven swings.
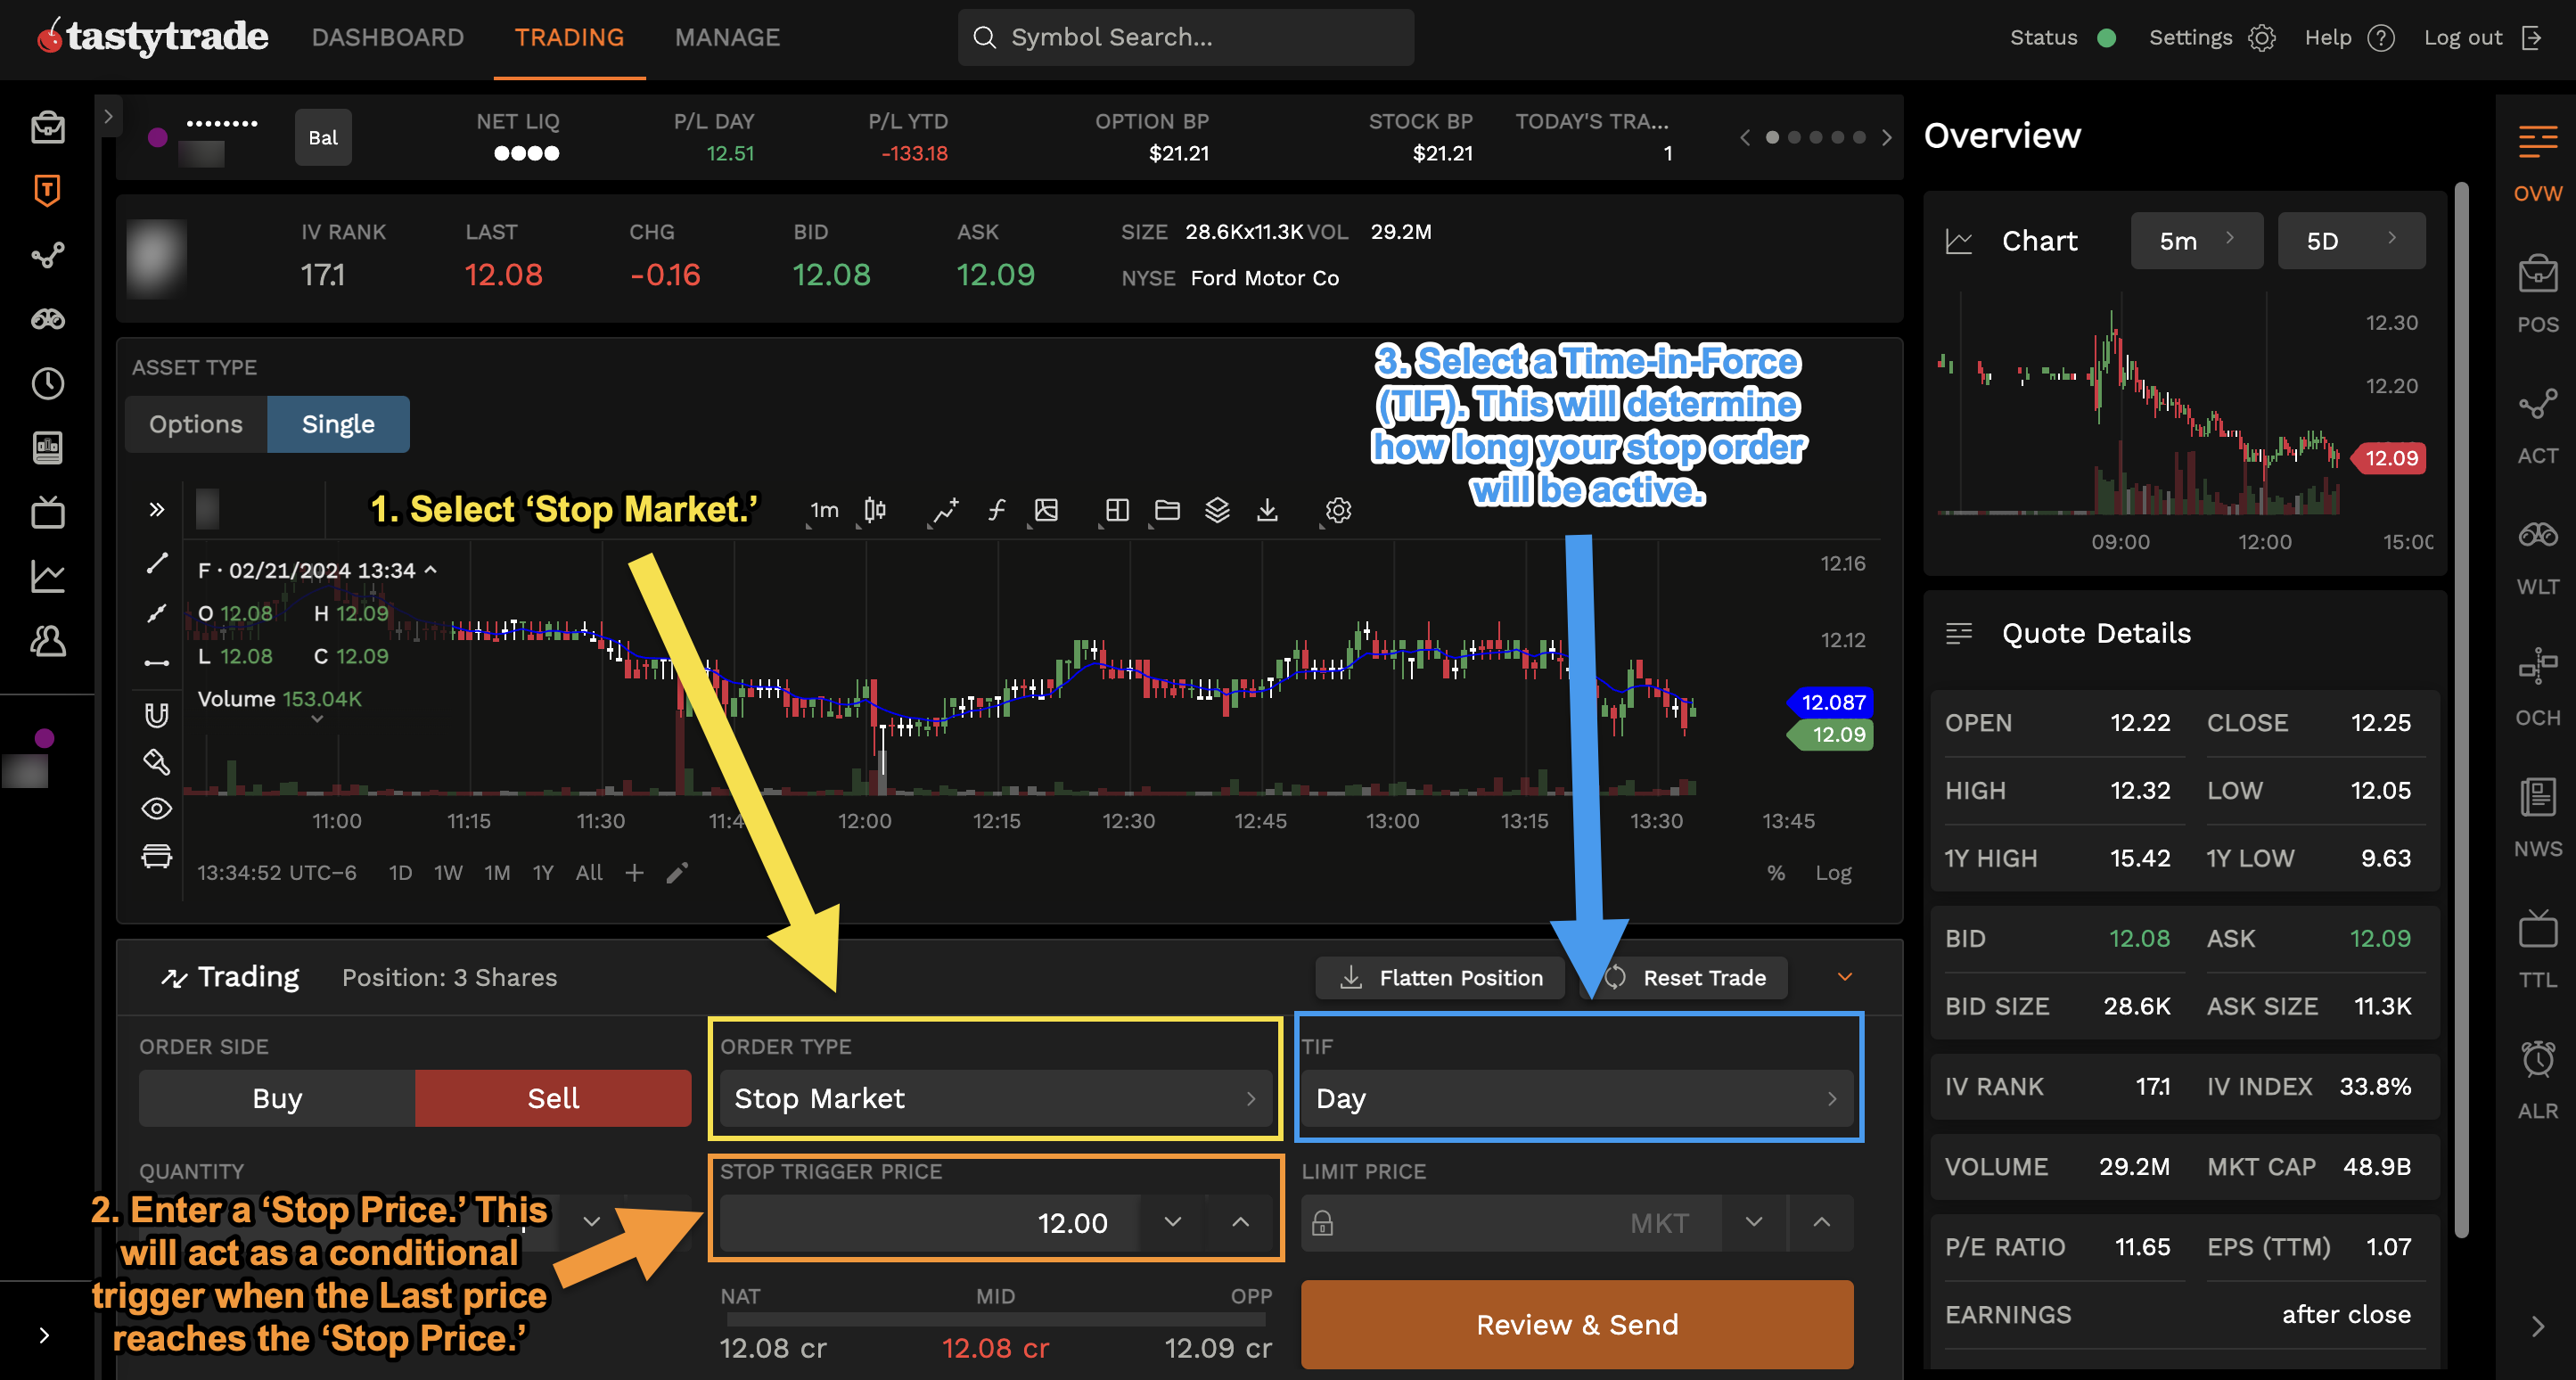
- Set Tight Stops: Protect capital against sudden adverse moves triggered by large position settlements.
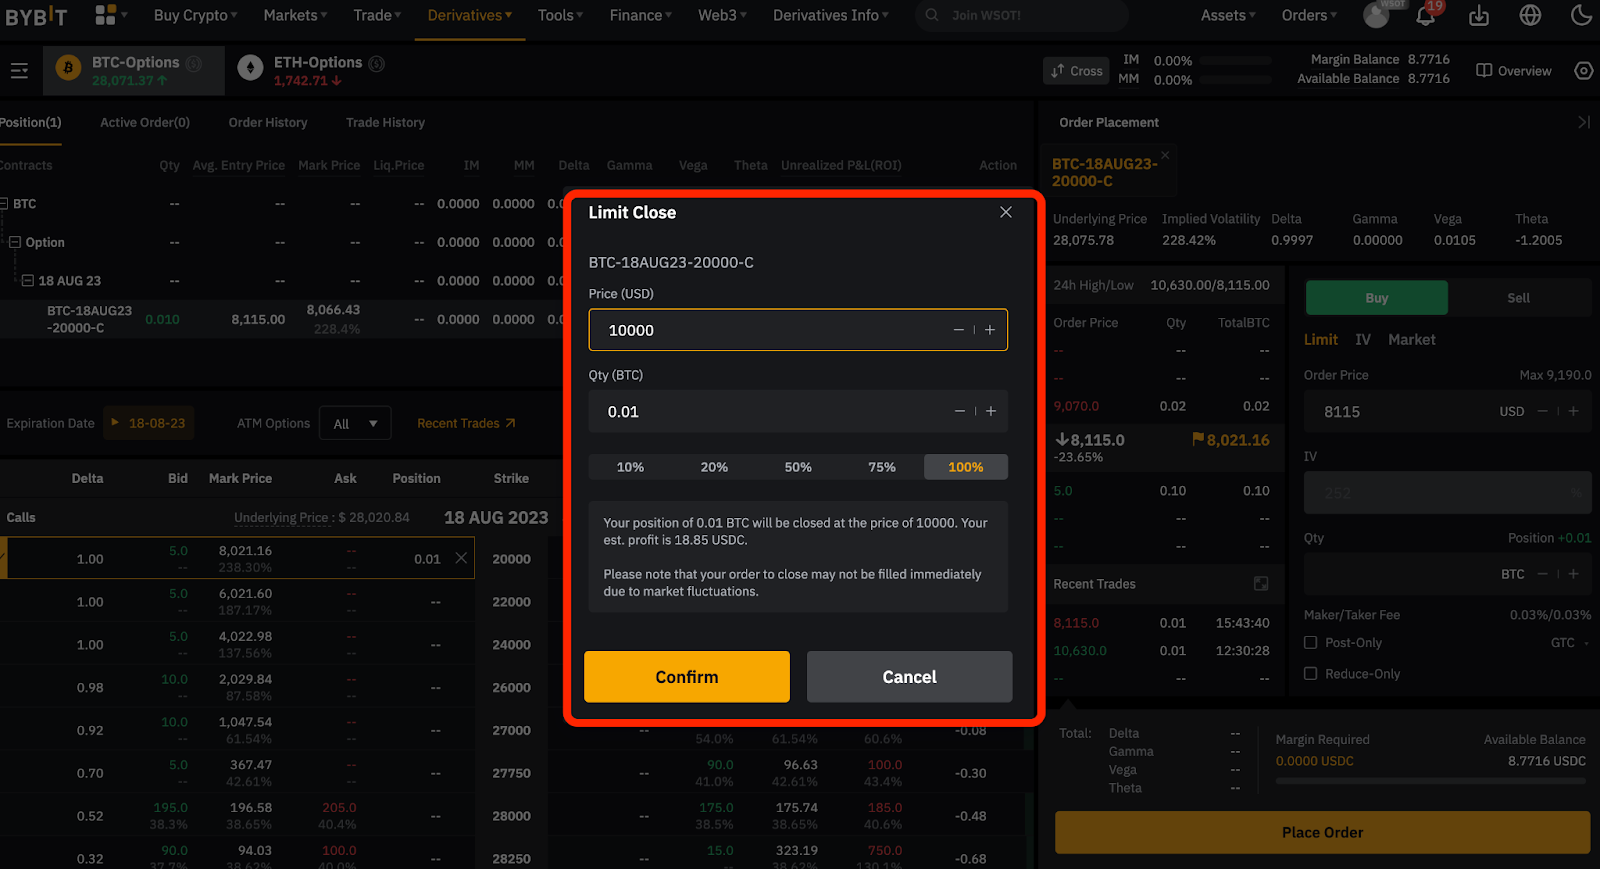
- Watch Arbitrage Opportunities: Discrepancies between spot and futures prices can open up short-term profit windows for nimble participants.
Do you adjust your trading strategy around CME Bitcoin futures expiries?
CME Bitcoin futures expirations can trigger volatility and influence market sentiment, as seen with Bitcoin currently trading at $113,939 (+1.68%). Some traders change their approach when expiries approach, while others stick to their usual strategy. How do you handle these key dates?
For traders in the crypto stock market, these periods of heightened activity can present both opportunity and risk. The key is to remain vigilant and methodical. The interplay between CME futures expiry and spot market action is most visible when liquidity is thin or sentiment is fragile, conditions that can amplify price moves well beyond what fundamentals alone would suggest.
Key Takeaways for Crypto Stock Traders at Current Price Levels
With Bitcoin trading at $113,939.00 and Ethereum at $4,112.99, the stakes around each CME expiry are higher than ever. Here’s what traders should keep in mind as they navigate these events:
CME Futures Expiry Risk Management Checklist
-

Monitor CME Bitcoin Futures Expiration Calendar: Stay updated on CME Group’s official schedule for upcoming Bitcoin futures expiries. This helps anticipate potential volatility windows.
-
Track Real-Time Spot and Futures Prices: Use reliable platforms like CoinMarketCap or Binance to monitor Bitcoin’s spot price ($113,939) and compare it with CME futures prices to identify possible arbitrage opportunities.
-
Monitor Altcoin Correlations: Track price movements of major altcoins like Ethereum (ETH at $4,112.99) using CoinMarketCap to anticipate spillover effects from Bitcoin futures expiry.
-
Review Recent Expiry Impact Reports: Consult research from sources like Cointelegraph or QuantPedia for data-driven insights on how past CME futures expiries have influenced crypto markets.
-

Stay Informed on Regulatory Announcements: Follow updates from the U.S. Commodity Futures Trading Commission (CFTC) and CME Group for any regulatory changes that could affect futures trading and expiry dynamics.
1. Expect Volatility Spikes: Even a minor shift in sentiment can move prices sharply when leverage is high. Prepare for sudden swings, especially near expiration hours.
2. Observe Cross-Asset Correlations: Bitcoin’s CME-driven volatility often spills over into top altcoins like Ethereum, Solana, or Binance Coin. Watch for synchronized moves that may signal broader portfolio rebalancing by large players.
3. Stay Informed on Expiry Dates: Mark CME Bitcoin futures expiration dates on your calendar and monitor open interest data closely in the days leading up to settlement.
Market Sentiment: Reading Between the Lines
The outcome of each expiry offers a window into market psychology. If a majority of contracts settle profitably for longs, it may embolden bullish traders going forward; if shorts dominate, expect caution or even selloffs in subsequent sessions. However, as recent research suggests, the relationship isn’t always straightforward, broader macroeconomic forces and liquidity conditions can override short-term expiry effects.
Building Resilience: Practical Steps for Navigating Expiry Events
A disciplined approach to trading around CME futures expiry includes:
- Tightening risk controls: Use stop losses and position sizing to limit downside if volatility spikes unexpectedly.
- Avoiding emotional trades: Don’t chase price moves driven by last-minute settlement flows, wait for confirmation before acting.
- Diversifying across assets: Spreading exposure beyond Bitcoin reduces vulnerability to single-asset shocks tied to futures settlement.
- Reviewing past performance: Study how previous expiries have affected your preferred assets; patterns often repeat but not always identically.
If you’re new to trading around CME expiries, consider starting with smaller positions until you gain confidence interpreting these complex market dynamics.
The next major expiry will be closely watched as both institutional and retail participants weigh their options at these elevated price levels. The best defense remains preparation, by understanding the mechanics of CME futures expiry and keeping emotions in check, traders can navigate these turbulent waters with greater confidence and discipline.