
MARA stock trades at $10.54 today, up 1.74% amid Bitcoin’s climb to $74,789. With the 2028 halving looming, swing traders eye this crypto mining play for its leverage to BTC cycles. Marathon Digital Holdings thrives on block rewards, but history shows these events spark volatility ripe for timed entries and exits.

Bitcoin Halving Mechanics and MARA’s Vulnerability
The next Bitcoin halving hits around April 2028, slashing rewards from 3.125 BTC to 1.5625 BTC per block. Miners like MARA face thinner margins unless BTC rallies hard. Post-2024 halving, MARA boosted production 35% by May 2025 yet posted a $1.71 billion Q4 loss from digital asset revaluations. Balance sheets strain; MARA offloaded over 15,000 BTC in March to shore up liquidity. Swing trading here demands precision: buy dips pre-halving on efficiency gains, sell peaks as hype fades.
This “twin-turbo” strategy, mining plus strategic buys, pads MARA’s HODL stack. Yet, reliance on volatile BTC makes it a high-beta bet. At current levels, $10.54 offers a swing base if BTC holds $74,789 support.
Historical Halving Cycles: MARA’s Proven Playbook
Past halvings fueled BTC surges that juiced MARA. After 2012, BTC multiplied 93x in a year; 2020 peaked at $68,000 on institutional flows. MARA mirrored these, though with amplified swings. Pre-2024, miners consolidated; post-event, production records followed. Expect similar for 2028: tighter supply drives BTC higher 12-18 months out, lifting efficient miners. But 2026’s tougher road, elevated energy costs, hash rate wars, tests resilience. Swing traders capitalize by scaling in on BTC pullbacks to $70,000 zones, targeting MARA breakouts above $12.
MARA’s neural network forecasts hint at upside through 2026, but Seeking Alpha flags overhyping. I see opportunity in medium-term BTC ties over short noise.
Setting Up Swing Trades for the 2028 Approach
Current MARA at $10.54 sits in a consolidation coil, BTC’s 3.57% gain signaling momentum. Key levels: support at $10.49 daily low, resistance near $11 high. Use RSI divergences for entries; MACD crossovers for momentum confirmation. Pre-halving, position for BTC’s historical 12-month ramp: allocate 5-10% portfolio, trail stops at 20-day SMA. MARA’s pivot to fees post-2028 adds defensiveness, but near-term, it’s pure cycle fuel.
Marathon Digital Holdings (MARA) Stock Price Prediction 2027-2032
Forecasts based on Bitcoin halving cycles, historical patterns, mining efficiency, and market volatility (Current 2026 price: $10.54)
| Year | Minimum Price | Average Price | Maximum Price | YoY % Change (Avg) |
|---|---|---|---|---|
| 2027 | $9.50 | $16.50 | $28.00 | +56.5% |
| 2028 | $14.00 | $28.00 | $55.00 | +69.7% |
| 2029 | $22.00 | $45.00 | $90.00 | +60.7% |
| 2030 | $30.00 | $60.00 | $120.00 | +33.3% |
| 2031 | $40.00 | $75.00 | $150.00 | +25.0% |
| 2032 | $50.00 | $95.00 | $200.00 | +26.7% |
Price Prediction Summary
MARA stock is poised for substantial upside post-2028 Bitcoin halving, mirroring historical BTC bull runs, with average prices potentially rising over 9x by 2032. Min prices account for bearish scenarios like prolonged BTC downturns or mining margin squeezes, while max reflect bullish adoption and efficiency gains.
Key Factors Affecting Marathon Digital Holdings Stock Price
- Bitcoin price surges post-2028 halving (historical 10-90x gains)
- MARA’s hash rate expansion and ‘twin-turbo’ HODL strategy
- Operational challenges: energy costs, block reward cuts to 1.5625 BTC
- Regulatory environment for crypto mining
- Broader BTC adoption and institutional investment
- Earnings volatility from digital asset revaluations
- Competition among miners and share dilution risks
Disclaimer: Stock price predictions are speculative and based on current market analysis.
Actual prices may vary significantly due to market volatility, economic conditions, and other factors.
Always do your own research before making investment decisions.
Monitor hashrate growth and energy deals; MARA’s output edge positions it ahead of peers. Swing windows open on BTC dips, close on euphoria spikes. Adapt to balance sheet shifts; profit lies in disciplined cycles.
Marathon Digital Holdings Technical Analysis Chart
Analysis by Market Analyst | Symbol: NASDAQ:MARA | Interval: 1D | Drawings: 5
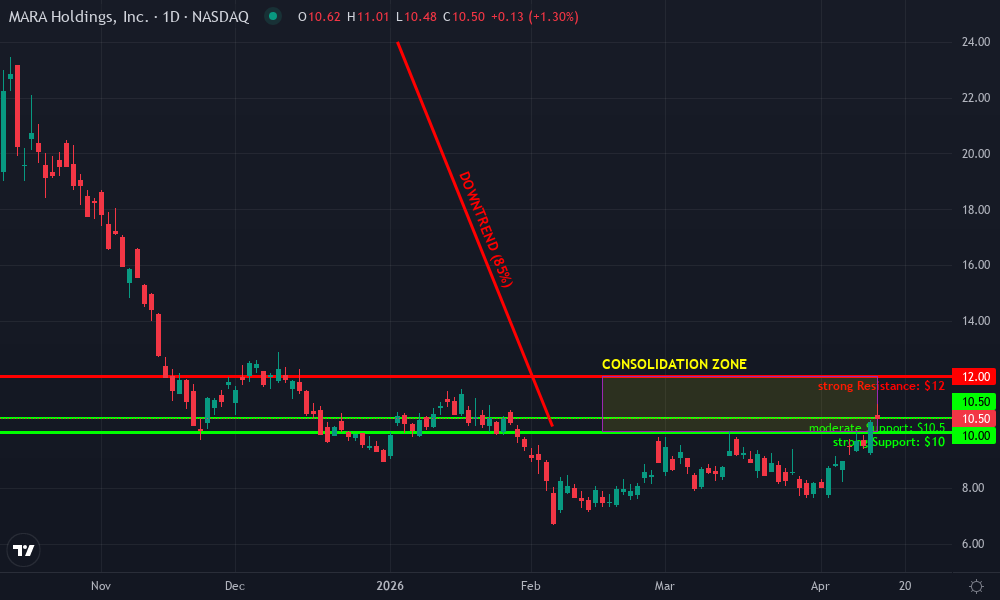
Technical Analysis Summary
To annotate this MARA daily chart in my balanced technical style: 1. Draw a prominent downtrend line connecting the December 2025/January 2026 high near $24 to the early February 2026 low around $10.20, extending it forward to project potential resistance. 2. Add horizontal lines at key support $10.00 (strong) and $10.50 (recent bounce), and resistance at $11.00, $12.00 (major). 3. Use a rectangle to highlight the ongoing consolidation range from late February to mid-April 2026 between $10.00-$12.00. 4. Mark a potential long entry zone near $10.75 with a long_position tool, profit target at $12.00, stop loss at $10.00. 5. Add callouts for volume spikes on the initial drop (distribution) and recent low volume (accumulation). 6. If MACD visible, arrow_mark_up on any bullish crossover near current levels. 7. Vertical line at early 2026 drop for ‘post-BTC correction’. Keep lines clean, use semi-transparent fills for ranges, labels concise.
Risk Assessment: medium
Analysis: High BTC correlation and halving uncertainty amplify volatility, but technical base at $10 with low vol supports measured swing trade
Market Analyst’s Recommendation: Consider long entry on hold above $10.50, target $12, SL $10; medium risk suits my tolerance, monitor BTC $74k
Key Support & Resistance Levels
📈 Support Levels:
-
$10 – Strong multi-touch low since drop, aligns with 24h low $10.49
strong -
$10.5 – Recent bounce level near current $10.54
moderate
📉 Resistance Levels:
-
$11 – 24h high $11.00, minor resistance
weak -
$12 – Multiple rejections in consolidation
strong
Trading Zones (medium risk tolerance)
🎯 Entry Zones:
-
$10.75 – Bounce from $10.50 support with green candle close, low vol accumulation
low risk
🚪 Exit Zones:
-
$12 – Consolidation high resistance, measured move target
💰 profit target -
$10 – Break of key support invalidates long
🛡️ stop loss
Technical Indicators Analysis
📊 Volume Analysis:
Pattern: declining on consolidation after spike on drop
High volume distribution on Jan drop, now low volume basing suggests accumulation
📈 MACD Analysis:
Signal: potential bullish crossover emerging
From choppy price, MACD likely flattening or crossing up from oversold, confirming bounce
Applied TradingView Drawing Utilities
This chart analysis utilizes the following professional drawing tools:
Disclaimer: This technical analysis by Market Analyst is for educational purposes only and should not be considered as financial advice.
Trading involves risk, and you should always do your own research before making investment decisions.
Past performance does not guarantee future results. The analysis reflects the author’s personal methodology and risk tolerance (medium).
Volatility favors the prepared. With BTC at $74,789, MARA’s $10.54 entry tempts, but wait for volume confirmation.
Volume spikes above average signal conviction; recent 24-hour action pushed MARA past its $10.49 low toward $11 resistance, mirroring BTC’s 3.57% advance from $74,789 base. Patience pays in swing trading crypto mining stocks like MARA, where Bitcoin halving 2028 trading setups reward those who filter noise.
Technical Signals for MARA Swing Entries
RSI on daily charts hovers near 55, neutral ground primed for bullish divergence if BTC tests $70,000 support. MACD histogram expands positively, hinting at momentum build. For MARA stock swing trading, target breakouts above $11 with volume 50% over 20-day average. Stops trail below $10.49 intraday low, preserving capital amid hash rate competition. Energy costs bite harder pre-2028, but MARA’s output surge post-2024 positions it to weather the storm better than peers.
Marathon Digital Holdings Technical Analysis Chart
Analysis by Market Analyst | Symbol: NASDAQ:MARA | Interval: 1D | Drawings: 7
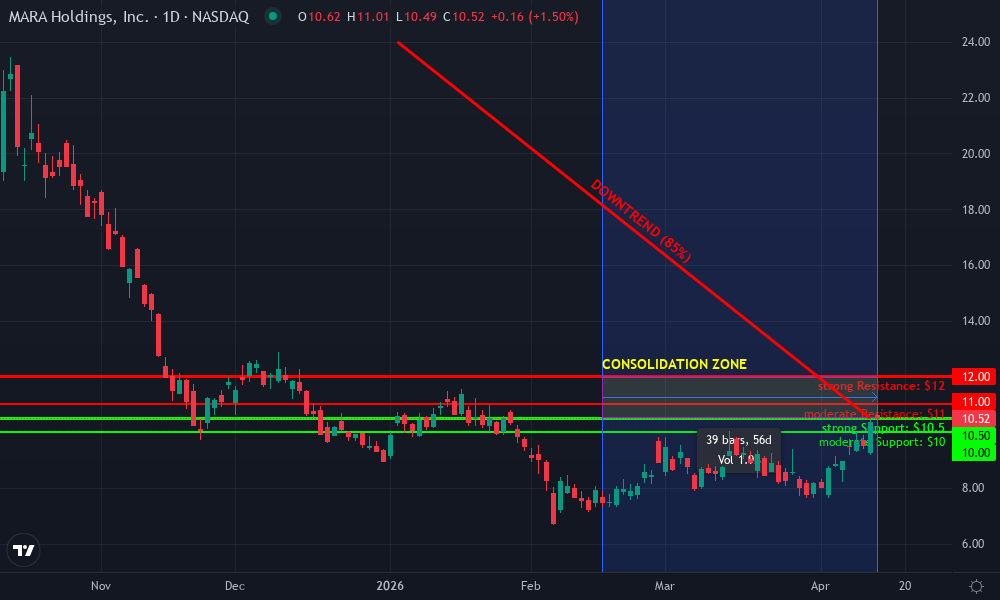
Technical Analysis Summary
To annotate this MARA daily chart effectively in my balanced technical style, start by drawing a primary downtrend line (trend_line) connecting the peak around 24.00 in early January 2026 to the recent lows near 10.50 in mid-April 2026, highlighting the dominant bearish channel. Add horizontal lines (horizontal_line) at key support 10.50 and resistance 12.00. Mark the recent consolidation rectangle (rectangle) from early March to now between 10.00-12.00. Use fib_retracement from the major high to low for potential retracement levels. Place callouts (callout) on volume spikes during the decline and text notes on MACD bearish crossover. Add long_position entry zone at 10.60 with stop_loss below 10.30 and profit_target at 11.50. Vertical lines for potential news impacts in late March. Arrow markers for recent bounce attempt.
Risk Assessment: medium
Analysis: Volatile miner stock tied to BTC, consolidation reduces immediate downside but halving anticipation adds uncertainty
Market Analyst’s Recommendation: Cautious long on support hold, scale in with stops for medium risk swing trade
Key Support & Resistance Levels
📈 Support Levels:
-
$10.5 – Recent lows and psychological support holding multiple tests
strong -
$10 – Minor extension below recent range, volume shelf
moderate
📉 Resistance Levels:
-
$11 – 24h high and upper consolidation band
moderate -
$12 – Prior swing high from March, key breakout level
strong
Trading Zones (medium risk tolerance)
🎯 Entry Zones:
-
$10.6 – Bounce from strong support at 10.50 with volume pickup, aligned with medium risk tolerance
medium risk
🚪 Exit Zones:
-
$11.5 – Measured move to resistance, fib 50% retrace
💰 profit target -
$10.3 – Below support invalidation
🛡️ stop loss
Technical Indicators Analysis
📊 Volume Analysis:
Pattern: High volume on declines, low on recent recovery indicating distribution
Bearish volume profile confirms downtrend strength
📈 MACD Analysis:
Signal: Bearish crossover with histogram contracting
Momentum weakening but potential divergence on oversold
Applied TradingView Drawing Utilities
This chart analysis utilizes the following professional drawing tools:
Disclaimer: This technical analysis by Market Analyst is for educational purposes only and should not be considered as financial advice.
Trading involves risk, and you should always do your own research before making investment decisions.
Past performance does not guarantee future results. The analysis reflects the author’s personal methodology and risk tolerance (medium).
Bitcoin cycle stock trades shine when aligning MARA entries with BTC’s 50-day SMA around $72,000. Historical patterns post-halving show miners lagging initial BTC pumps before catching up 3-6 months in. At $10.54, risk-reward skews favorable for 20-30% swings if BTC grinds higher.
Execution Blueprint: Step-by-Step MARA Swings to 2028
Swing traders thrive on structure. MARA’s twin-turbo approach, blending mining yields with BTC buys, bolsters its HODL amid thinner rewards ahead. Yet, Seeking Alpha’s caution on overhype rings true; pivot to transaction fees post-halving demands watching. I favor disciplined plays over HODL forever, scaling out 50% at 25% gains to fund fresh entries.
This framework adapts to tougher balance sheets; MARA’s March BTC sales trimmed debt without gutting reserves. Neural forecasts point to 2026 upside, but I temper with cycle realism: 2028 rewards favor efficient operators. Crypto mining stocks 2028 hinge on hashrate dominance and fee capture.
MARA trading strategies evolve with market grit. Post-2024 production highs mask Q4 losses from BTC dips, underscoring leverage’s double edge. Swing in on operational wins like block records; swing out before euphoria peaks 12 months pre-halving. Current $10.54 consolidates with purpose, BTC’s $74,789 floor intact.
MARA’s edge lies in execution amid volatility. Balance sheets tighten, but twin-turbo fuels resilience. Swing smart, not hard.
Broader context sharpens the play. Miners brace for 2028’s reward cut, pushing efficiency races. MARA leads with scale, yet volatility demands tight risk controls: never risk more than 2% per trade. Portfolio allocation caps at 10% for this high-beta name. As BTC cycles tighten supply, MARA swings amplify returns for the adaptive.
Pragmatism rules: BTC at $74,789 tempts longs, but confirm with candlestick closes above key moving averages. MARA’s $10.54 base holds firm, eyeing $12 and on cycle momentum. Track peer hashrates; outpace them, and upside follows. In Bitcoin halving 2028 trading, timing trumps conviction. Position accordingly, monitor relentlessly, and let cycles deliver.