Bitcoin hovers at $76,404.00 after dipping $1,793.00 over the past 24 hours, underscoring the razor-thin margins in crypto leverage trading. With perpetual futures volumes surging into 2026, traders chasing 10x leverage on BTC face amplified crypto leverage trading risks that can wipe out positions in minutes. I’ve seen cycles where macro shifts turn minor dips into liquidation cascades, and right now, volatility lingers just below the surface.

Perpetual contracts let you control massive exposure with minimal capital, but 10x means a 10% adverse move against your position spells doom, fees included. At today’s BTC price of $76,404.00, opening a $10,000 long with 10x leverage gives you $100,000 notional. A drop to around $68,764 erases your margin entirely. That’s no hyperbole; Coinglass data shows liquidation treadmills grinding portfolios during corrections.
Decoding Liquidation Mechanics in High-Leverage Perps
Liquidation hits when your margin ratio breaches the exchange threshold, typically 100% maintenance margin. For 10x, your buffer shrinks fast. Platforms like those topping BeInCrypto’s 2026 high-leverage list enforce isolated or cross-margin modes, but neither forgives poor positioning. Funding rates add another layer; positive rates bleed longs when markets stagnate, as we’ve seen in recent BTC consolidation around $76,404.00.
Proactive monitoring trumps hope. Tools tracking open interest reveal overcrowding in longs, priming cascades. Coinbase emphasizes lower leverage like 3x slashes this risk, extending your runway from 10% to over 30% price swings. Yet, the allure of 10x persists for cycle hunters spotting macro reversals.
Macro Cycles Fueling 2026 Leverage Perils
Cycles matter, and 2026 shapes up as a leverage battleground. Bitcoin’s path from $76,404.00 tests post-halving dynamics, where ETF inflows clash with regulatory shadows. AInvest flags mass liquidation risks at critical levels; we’re dancing near supports that, if breached, trigger domino effects in perps. Volatility spikes, not seen since 2022, compound perp trading risk management challenges.
Historical parallels? 2021’s euphoria saw 10x positions evaporate on 15% wicks. Today, with BTC at $76,404.00, similar setups brew amid altcoin rotations. My view: institutional flows stabilize bases, but retail FOMO on leverage ignites fireworks. Sharpnel-Trading notes 2-5x offers buffers fitting normal volatility, preserving capital for true cycle pivots.
Bitcoin (BTC) Price Prediction 2027-2032
Forecasts amid leverage trading risks, market cycles, and adoption trends (2026 baseline average: $90,000)
| Year | Minimum Price | Average Price | Maximum Price | YoY % Change (Avg) |
|---|---|---|---|---|
| 2027 | $80,000 | $120,000 | $200,000 | +33% |
| 2028 | $100,000 | $180,000 | $350,000 | +50% |
| 2029 | $140,000 | $250,000 | $500,000 | +39% |
| 2030 | $180,000 | $320,000 | $650,000 | +28% |
| 2031 | $220,000 | $400,000 | $800,000 | +25% |
| 2032 | $280,000 | $500,000 | $1,000,000 | +25% |
Price Prediction Summary
Bitcoin is forecasted to exhibit strong long-term growth from 2027-2032, with average prices rising from $120,000 to $500,000, driven by halving cycles, institutional adoption, and technological upgrades. Bearish mins account for corrections and leverage-induced volatility, while bullish maxes reflect peak adoption scenarios. Leverage traders must use low leverage (e.g., 2-5x) and risk management to avoid liquidations in volatile conditions.
Key Factors Affecting Bitcoin Price
- 2028 Bitcoin halving increasing scarcity and historical price surges
- Growing institutional adoption via ETFs and corporate treasuries
- Regulatory developments providing clarity or hurdles
- Scalability improvements like Lightning Network enhancing usability
- High leverage trading risks amplifying volatility and liquidation events
- Macroeconomic trends including inflation hedging and interest rates
- Competition from altcoins and potential CBDC impacts
Disclaimer: Cryptocurrency price predictions are speculative and based on current market analysis.
Actual prices may vary significantly due to market volatility, regulatory changes, and other factors.
Always do your own research before making investment decisions.
Battle-Tested Tactics for Safe 10x Deployment
Ditch the all-in mindset; allocate no more than 1-2% capital per trade. This 10x leverage crypto guide staple curbs drawdowns. Set stop-losses 5-7% from entry, tighter than liquidation price to dodge slippage. For a long at $76,404.00, target exit below $72,584 before exchanges auto-close you.
Scale in positions gradually, layering buys on confirmations like RSI divergences or funding rate flips. XT. com preaches appropriate leverage sizing; pair 10x with wide stops during low-vol regimes. Deposit collateral mid-trade to inflate margins, a CryptoPotato tactic staving off calls. MetaMask basics remind us: grasp funding, mark price vs. index to sidestep oracle manipulations.
Position sizing formulas ground this. Risk = (Entry – Stop) * Size * Leverage. Cap at portfolio 1%. At $76,404.00 BTC, this math keeps you solvent through 20% swings. Track via Coinglass heatmaps; overcrowded trades scream exit. My edge: macro overlays, watching DXY for USD strength pressuring crypto.
Layering macro signals sharpens entries. Watch Bitcoin’s $76,404.00 hold against DXY rallies; a weakening dollar often fuels crypto legs higher, justifying 10x on confirmed uptrends. But ignore altcoin leverage traps; BTC dominance dictates flows in 2026 cycles.
Essential Tools and Platforms for 2026 Perp Trading
Top high-leverage platforms in BeInCrypto’s 2026 roundup offer up to 125x, but stick to audited ones with robust liquidation engines. Features like auto-deleverage protect during cascades, yet user error remains king. Integrate Coinglass for real-time liquidation heatmaps and funding rate trackers; these reveal when 10x longs overcrowd, signaling reversals.
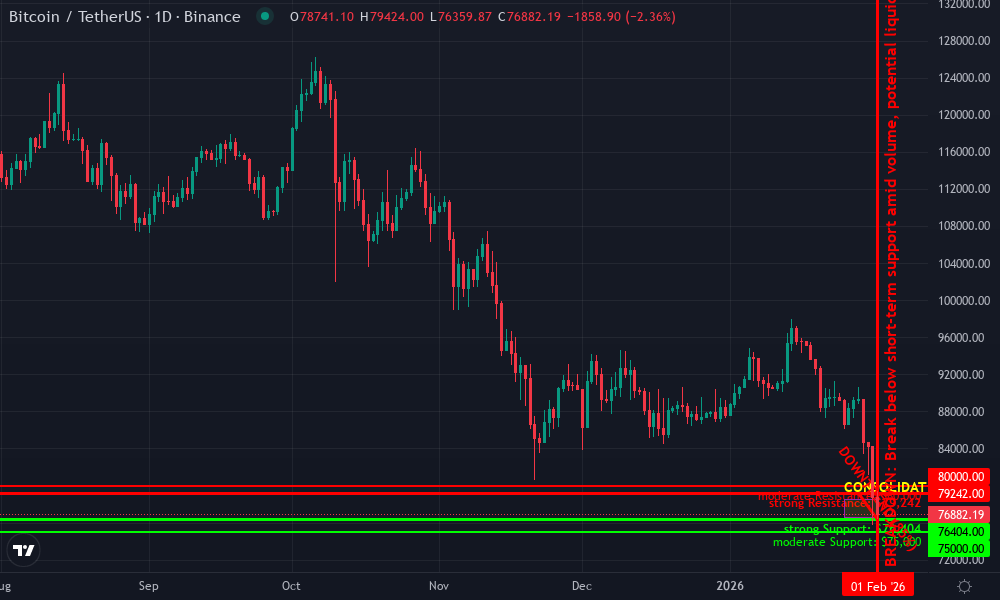
Bitcoin Technical Analysis Chart
Analysis by Market Analyst | Symbol: BINANCE:BTCUSDT | Interval: 1D | Drawings: 7
Technical Analysis Summary
To annotate this BTCUSDT 1D chart effectively in my balanced technical style, start by drawing a prominent downtrend line connecting the recent swing high on 2026-01-28 at $79,242 to the current low on 2026-02-01 at $76,404, highlighting the short-term bearish momentum. Add horizontal lines at key support $76,404 (strong, today’s low) and resistance $79,242 (strong, 24h high). Use Fibonacci retracement from the recent low to high for potential pullback levels around $77,800 (38.2%). Mark a consolidation rectangle from 2026-01-25 to 2026-02-01 between $76,400-$78,500. Place arrow_mark_down on MACD bearish crossover around 2026-01-30, and callout on volume spike during downside on 2026-02-01 indicating distribution. Add vertical_line for potential news event impact on 2026-02-01. Finally, text box for entry zone near support with stop-loss below $76,000.
Risk Assessment: medium
Analysis: Volatile crypto market with leverage liquidation risks high; support hold could reverse, but bearish indicators suggest caution—use 2-5x leverage max, strict stops essential in 2026 futures environment
Market Analyst’s Recommendation: Wait for support bounce confirmation above $77,000 before longing small position; avoid high leverage to mitigate 10% adverse move liquidation threat; balanced: 50/50 bull/bear short-term
Key Support & Resistance Levels
📈 Support Levels:
-
$76,404 – 24h low and psychological support, confluence with prior lows
strong -
$75,000 – Next major support if breaks, aligns with 200-day MA approx
moderate
📉 Resistance Levels:
-
$79,242 – 24h high, immediate overhead resistance
strong -
$80,000 – Round number resistance with prior rejections
moderate
Trading Zones (medium risk tolerance)
🎯 Entry Zones:
-
$76,500 – Potential bounce from strong support with volume divergence, low-risk long setup for medium tolerance
low risk -
$78,500 – Break above resistance for bullish confirmation, higher reward short-term long
medium risk
🚪 Exit Zones:
-
$79,242 – Take profit at resistance retest
💰 profit target -
$79,200 – Trailing stop if breaks higher
💰 profit target -
$76,000 – Stop loss below support to avoid liquidation cascade
🛡️ stop loss
Technical Indicators Analysis
📊 Volume Analysis:
Pattern: Increasing on downside, bearish distribution
Volume spikes on red candles near 2026-02-01 confirm selling pressure
📈 MACD Analysis:
Signal: Bearish crossover
MACD line crossed below signal around 2026-01-30, momentum fading
Applied TradingView Drawing Utilities
This chart analysis utilizes the following professional drawing tools:
Disclaimer: This technical analysis by Market Analyst is for educational purposes only and should not be considered as financial advice.
Trading involves risk, and you should always do your own research before making investment decisions.
Past performance does not guarantee future results. The analysis reflects the author’s personal methodology and risk tolerance (medium).
Combine with TradingView for custom alerts on BTC at $76,404.00 supports. My routine: scan open interest spikes pre-NFP releases, as macro data jolts volatility. This avoid liquidation crypto futures discipline turns 10x from gamble to edge.
Leverage Risk Breakdown: A Quick Reference
Leverage Levels vs. Price Drop to Liquidation (Buffer %) for $10K Margin on BTC ($76,404)
| Leverage | Position Size ($) | Buffer % (No Fees) | Buffer % (w/ 0.5% Fees Impact) | Liq. Price (w/ 0.5% Fees Impact) |
|---|---|---|---|---|
| 2x | $20,000 | 50.0% | 49.5% | $38,584 |
| 5x | $50,000 | 20.0% | 19.5% | $61,505 |
| 10x | $100,000 | 10.0% | 9.5% | $69,146 |
| 20x | $200,000 | 5.0% | 4.5% | $72,966 |
That table underscores why 10x demands precision. At current BTC levels, 20x evaporates on 5% dips; scale wisely.
Your Leverage Trading Strategies Crypto Checklist
Tick these religiously, and 10x becomes viable amid 2026’s volatility. I’ve guided clients through 2022’s wreckage by enforcing such rules; survivors compounded into bull legs.
Funding rates deserve a spotlight. Positive rates, common in BTC bulls around $76,404.00, drain longs hourly. Counter by timing entries post-flips or hedging shorts. XT Exchange guides stress this; ignore, and erosion precedes liquidation.
Common pitfalls? Revenge trading post-loss, chasing wicks without stops, or cross-margin everything. Isolated mode isolates pain. For perp trading risk management 2026, diversify across chains; Solana perps offer liquidity without ETH gas wars.
Looking ahead, Bitcoin’s $76,404.00 base tests halving cycle resilience. ETF balances swell, but leverage excesses invite corrections. My call: 10x shines on macro tailwinds like Fed pivots, but bunker with stops. Cycles reward the timed, not the reckless. Master these layers, and navigate 2026’s leverage arena unscathed.