
As February 2026 unfolds, the crypto stock landscape resembles a battlefield scarred by relentless declines. Strategy Inc. (MSTR) trades at $134.93, reflecting a volatile 24-hour swing from a low of $109.45 to a high of $137.70, with a net change of and $27.92 ( and 0.2609%). Yet this masks deeper wounds: MSTR, MARA Holdings (MARA), BitMine Immersion Technologies (BMNR), and Circle (CRCL) have cratered 80-90% from their peaks. Bitcoin's slip below $70,000 has triggered this rout, punishing firms tethered to cryptocurrency fortunes. For long-term investors like myself, these moments test resolve, but they also unearth opportunities buried under panic.
The correlation is stark. Strategy Inc. , the globe's top corporate Bitcoin holder, has shed nearly 50% in three months alone, lagging the financial sector badly. Miners like MARA face added pressures from a recent $850 million convertible note offering, sparking dilution fears and a 9.6% single-day plunge. BitMine and Circle, exposed through immersion tech and stablecoin operations, echo this pain as Bitcoin's downdraft erodes revenues and investor confidence. I've watched cycles like this before; they stem from leverage unwinding and macro headwinds, not fundamental rot.
Bitcoin's Sub-$70,000 Break Fuels the Fire
Bitcoin dipping under $70,000 acts as the detonator. Companies like Strategy Inc. hold massive BTC reserves, turning their balance sheets into leveraged bets on crypto's king. When Bitcoin falters, so do these proxies; MSTR's $134.93 price embodies months of erosion from highs above $600 in some metrics. Reuters noted Strategy shares falling from $457 in July to lows near $111, a trajectory accelerating into 2026. This isn't isolated; broader market jitters amplify the drop, with leveraged positions forcing sales that cascade downward.
Miners amplify the volatility. MARA Holdings' production costs spike in low-price environments, squeezing margins. Their stock's turbulence ties directly to Bitcoin's price action, where hash rate competition and energy costs compound the misery. BitMine Immersion Technologies (BMNR) shares similar woes, as immersion cooling tech fails to insulate against BTC's slump. Even Circle (CRCL), with its USDC stablecoin focus, suffers spillover effects from ecosystem distrust, as yields on reserves plummet.
Strategy Inc. (MSTR): Epicenter of the Crash
At $134.93, Strategy Inc. stands as the poster child for crypto stock carnage. Once surging over 1,000% from February to November 2024, MSTR has retraced brutally, down 80% from record highs per Binance reports hitting $100 lows. Bitcoin Magazine captured an 8% daily plummet amid one-year BTC lows. As portfolio manager, I view MSTR as a high-beta Bitcoin play; its 50% three-month slide underscores underperformance versus diversified peers. Yet holdings remain intact, positioning it for asymmetry if Bitcoin stabilizes.
Barrons highlighted weekend Bitcoin sinks dragging MSTR lower, a pattern repeating as risk assets unwind. This isn't bankruptcy territory; it's a capitulation phase where weak hands exit, leaving resilient structures.
MicroStrategy (MSTR) Stock Price Prediction 2027-2032
Post-2026 Crypto Crash Recovery Outlook and Rebound Scenarios
| Year | Minimum Price | Average Price | Maximum Price | YoY % Change (Avg from Prior Year) |
|---|---|---|---|---|
| 2027 | $110.00 | $250.00 | $450.00 | +85% (from 2026 $135) |
| 2028 | $180.00 | $400.00 | $700.00 | +60% |
| 2029 | $300.00 | $650.00 | $1,100.00 | +62.5% |
| 2030 | $450.00 | $950.00 | $1,600.00 | +46% |
| 2031 | $650.00 | $1,300.00 | $2,100.00 | +37% |
| 2032 | $900.00 | $1,700.00 | $2,700.00 | +31% |
Price Prediction Summary
Following the 2026 crypto stock crash where MSTR plummeted 80-90% amid Bitcoin's decline below $70K, the stock is forecasted to stage a robust multi-year recovery. Driven by Bitcoin's rebound potential, MSTR's massive BTC holdings (world's largest corporate holder), and strategic capital raises, average prices are projected to rise from $250 in 2027 to $1,700 by 2032 (CAGR ~66%). Minimums reflect bearish BTC stagnation or regulation risks; maximums assume bullish BTC adoption to $200K+. Rebound strategies include dollar-cost averaging, stop-losses at 20% below avg, and pairing with defensive assets.
Key Factors Affecting MicroStrategy Stock Price
- Bitcoin price recovery and volatility (key driver, currently rebounding from $60K dip)
- MSTR's BTC treasury expansion and low-cost debt financing
- Regulatory clarity on crypto assets and ETFs
- Macroeconomic factors: interest rates, inflation, and risk-on sentiment
- Company fundamentals: software revenue stability amid BTC leverage
- Competition from MARA, BMNR, CRCL, and sector dilution risks
- Technical patterns: RSI oversold rebound, 200-day MA crossover potential
Disclaimer: Stock price predictions are speculative and based on current market analysis. Actual prices may vary significantly due to market volatility, economic conditions, and other factors. Always do your own research before making investment decisions.
MARA, BitMine, and Circle: Miners and Enablers in Freefall
MARA Holdings exemplifies miner distress. A 9.6% drop tied to dilution risks from debt raises signals cash burn in a sub-$70,000 Bitcoin world. Production metrics falter without price support, eroding 80-90% from peaks alongside peers. BitMine (BMNR) charts parallel paths, with immersion tech promising efficiency yet yielding to market gravity. Yahoo Finance noted BMNR leading rebounds from $60K BTC dips, hinting at snap-back potential, but current levels reflect sustained pain.
Circle (CRCL) deviates slightly, banking on stablecoin stability, but ecosystem tremors hit hard. Down 80-90%, it underscores how no crypto-adjacent firm escapes Bitcoin's shadow. TheStreet reported rallies up to 25% post-relief, with MARA and others bouncing, yet 2026's crash reasserts dominance of the underlying asset.
These declines, while severe, align with historical precedents. Post-crash, focus shifts to rebound setups: portfolio rebalancing toward diversification, defensive tilts into bonds or utilities, and disciplined stop-losses. I've advised clients through worse; clarity today builds tomorrow's gains.
Navigating this crypto stocks crash 2026 demands MSTR stock trading strategies that prioritize survival first, then selective aggression. Historical rebounds, like the 25% crypto stock rally chronicled by TheStreet after relief rallies in Strategy, MARA Holdings, and peers, remind us volatility cuts both ways. Bitcoin's bounces from $60K lows propelled MSTR up 24% in past instances, per TIKR reports, turning dead-cat bounces into sustained climbs. At $134.93, Strategy Inc. offers a compelling entry for those with conviction in Bitcoin's long-term trajectory above $70,000.
Rebound Trading Strategies: Layered Approaches for Recovery
For MARA holdings rebound plays, start with technical validation. Charts show MSTR and MARA forming potential double bottoms near current lows, signaling exhaustion. I recommend scaling in on confirmed higher lows, targeting 20-30% upside if Bitcoin reclaims $70,000. BitMine Circle crypto stocks follow suit; BMNR's immersion edge could shine as energy costs stabilize, while Circle's USDC reserves provide a yield buffer absent in pure miners. Diversify entries: allocate no more than 5% per position initially, expanding on momentum.
Defensive positioning tempers the trade crypto stocks recovery. Shift 20-30% of crypto exposure to gold ETFs or utility stocks, which held firm during the plunge. Government bonds yield stability, countering Bitcoin's beta. I've rebalanced client portfolios this way post-2022 crash, preserving capital for the snapback. Stop-loss orders at 10-15% below entry points, like $121 for MSTR's $134.93 base, enforce discipline without emotional interference.
MicroStrategy Technical Analysis Chart
Analysis by Jessica Navarro | Symbol: NASDAQ:MSTR | Interval: 1W | Drawings: 6
Technical Analysis Summary
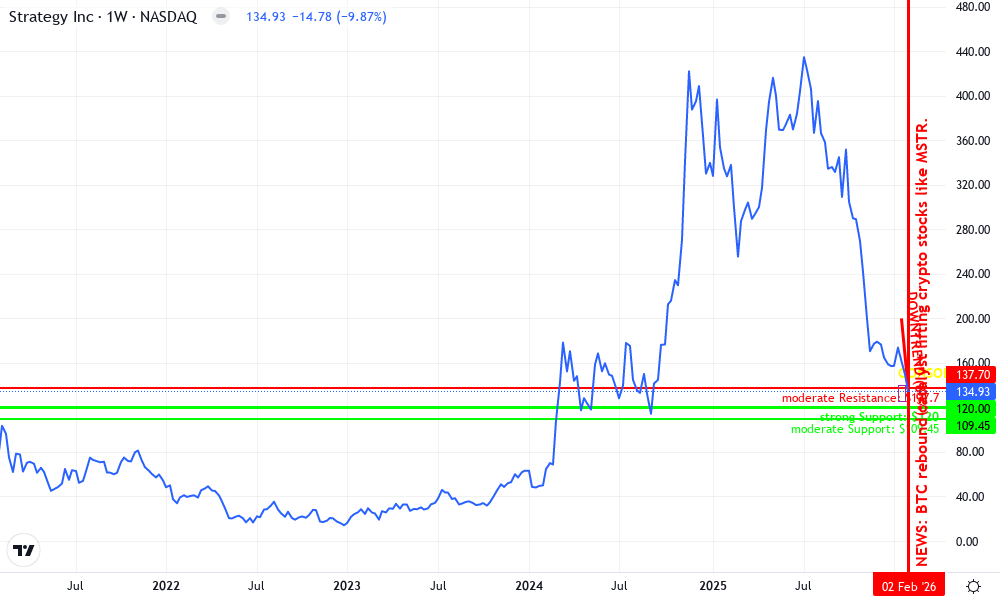
As Jessica Navarro, my conservative technical validation complements a fundamental lens on MSTR's Bitcoin-heavy balance sheet. On this log-scale chart spanning recent 2026 action, draw a prominent downtrend line from the early-year high connecting swing highs at 2026-01-20 (high ~$200) to 2026-02-05 (~$140), extending to project near-term resistance around $138. Add horizontal support at $109.45 (24h low) and $120 (prior consolidation base), with resistance at $137.70 (24h high). Use fib retracement from recent low $109.45 to high $137.70 for pullback zones (38.2% at ~$126). Mark volume spike on rebound with upward arrow callout. Text box for MACD bullish divergence note. Rectangle for mid-Jan consolidation. Vertical line at 2026-02-08 for BTC rebound catalyst. Overall, conservative lines emphasize caution amid volatility.
Risk Assessment: medium
Analysis: High volatility tied to BTC, recent 80% YTD drawdown, but rebound shows resilience; low tolerance favors waiting for trend confirmation.
Jessica Navarro's Recommendation: Hold existing positions; consider small scale-in at $120 support for long-term portfolio allocation, diversified with non-crypto assets.
Key Support & Resistance Levels
📈 Support Levels:
- $109.45 - 24h low and recent swing low; initial defense. moderate
- $120 - Prior consolidation base in late Jan 2026. strong
📉 Resistance Levels:
- $137.7 - 24h high; near-term overhead from downtrend. moderate
- $150 - Psychological and fib 50% retrace projection. weak
Trading Zones (low risk tolerance)
🎯 Entry Zones:
- $120 - Strong support confluence if holds amid BTC stabilization; conservative dip-buy for long-term. low risk
- $126 - Fib 38.2% retrace on rebound; validation via volume. medium risk
🚪 Exit Zones:
- $137.7 - Profit target at resistance test. 💰 profit target
- $105 - Trailing stop below key support. 🛡️ stop loss
Technical Indicators Analysis
📊 Volume Analysis:
Pattern: bullish spike
Volume surge on 26% rebound candle, supporting relief bounce.
📈 MACD Analysis:
Signal: bullish divergence
MACD histogram turning positive amid price low, hinting momentum shift.
Applied TradingView Drawing Utilities
This chart analysis utilizes the following professional drawing tools:
Disclaimer: This technical analysis by Jessica Navarro is for educational purposes only and should not be considered as financial advice. Trading involves risk, and you should always do your own research before making investment decisions. Past performance does not guarantee future results. The analysis reflects the author's personal methodology and risk tolerance (low).
Advanced tactics blend fundamentals with momentum. Monitor hash rates for MARA and BitMine; efficiency gains signal operational resilience amid sub-$70,000 Bitcoin. Strategy Inc. 's BTC hoard, intact despite the rout, amplifies upside asymmetry; a return to $100K Bitcoin could double MSTR from $134.93. Use options for convexity: buy cheap calls expiring in 3-6 months, hedging with protective puts. This setup captured the 1,000% 2024 surge for early entrants.
Risk management anchors every rebound. Position sizing scales with volatility; in this 80-90% drawdown, start small and pyramid on strength. Track macro catalysts: Federal Reserve pauses or ETF inflows could ignite Bitcoin above $70,000, lifting all boats. Past plunges, like Reuters' noted drop from $457 to $111, preceded multi-fold recoveries for patient holders.
Opinionated take: pure dip-buying sans strategy invites ruin, but structured plays reward foresight. MSTR at $134.93 embodies the high-conviction bet; pair it with MARA for mining leverage, BitMine for tech differentiation, and Circle for stability. Yahoo Finance's rebound charts from $60K BTC dips validate this rotation. As cycles turn, those acting with clarity today position for tomorrow's growth. Sustainable portfolios weather crashes, emerging stronger when Bitcoin stabilizes and equities follow.
Ultimately, this crypto stocks crash 2026 prunes weak positions, rewarding resilient frameworks. I've built wealth through four such cycles by blending patience with precision. Focus on verifiable edges, ignore noise, and let compounding do the rest.
No comments yet. Be the first to share your thoughts!