Identifying a crypto market bottom is one of the most challenging yet potentially rewarding skills in trading. With volatility at the heart of digital asset markets, catching the lowest point before a reversal can yield outsized returns. The key lies in combining several technical signals rather than relying on a single indicator. In this article, we’ll break down three essential crypto market bottom indicators: the RSI oversold signal, confirmation at major historical support levels, and evidence of liquidity sweeps that often precede sharp reversals.
RSI Oversold Signal: Reading Momentum Shifts
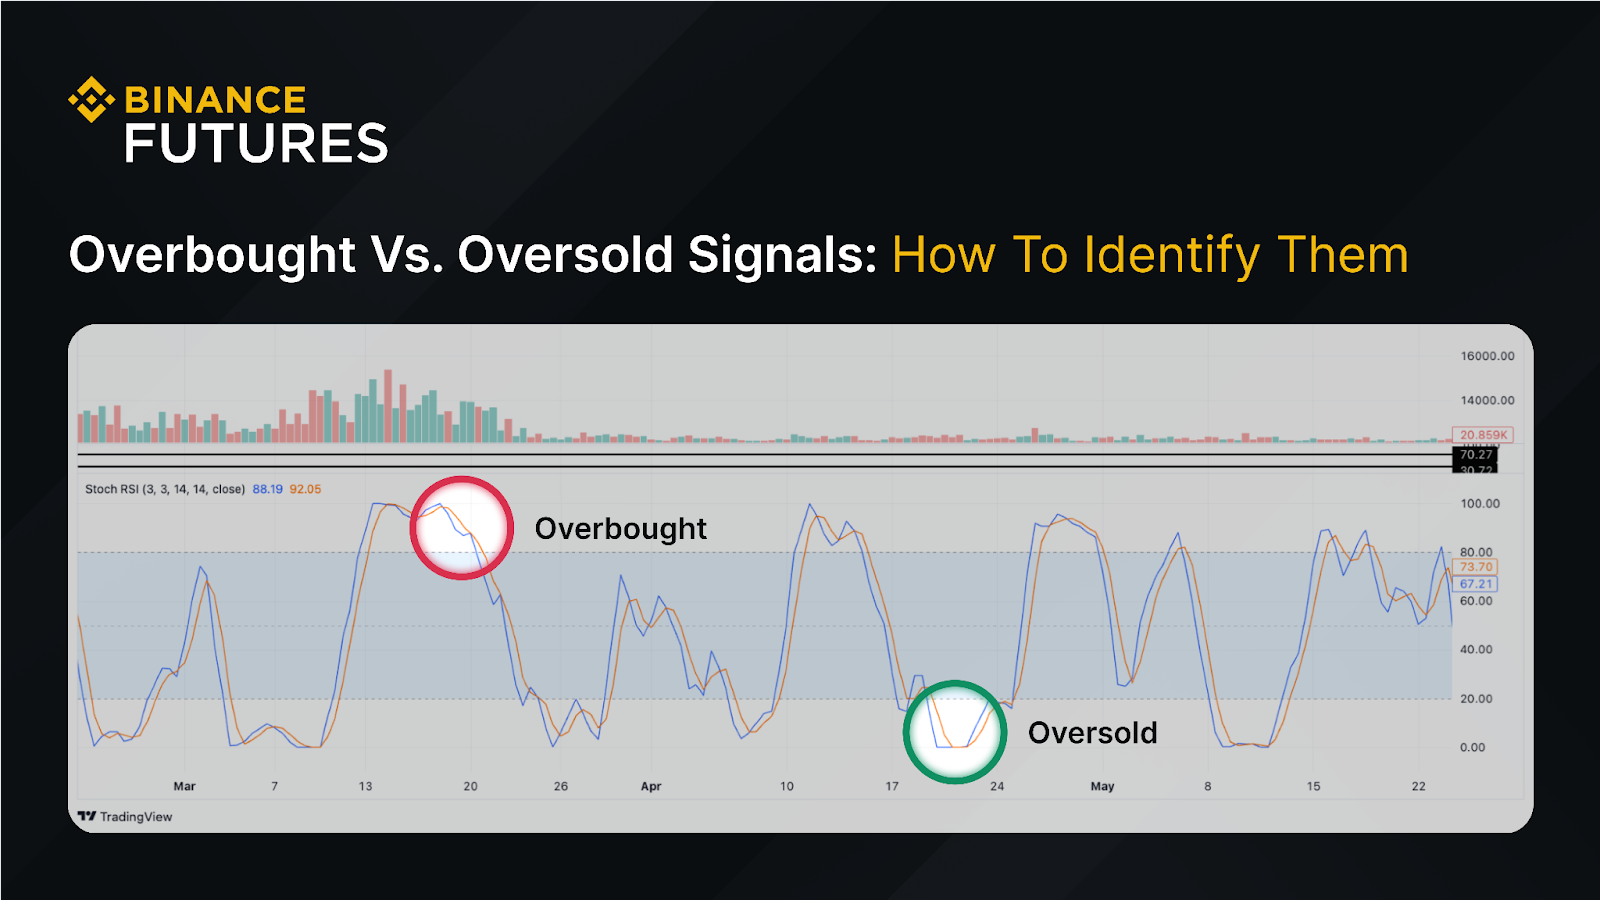
The Relative Strength Index (RSI) is a widely used momentum oscillator that measures the speed and change of price movements. On a scale from 0 to 100, readings below 30 are considered oversold. This can indicate that selling pressure may be exhausted and a reversal could be near. However, context is critical. In strong downtrends, RSI can remain below 30 for extended periods as sellers dominate.
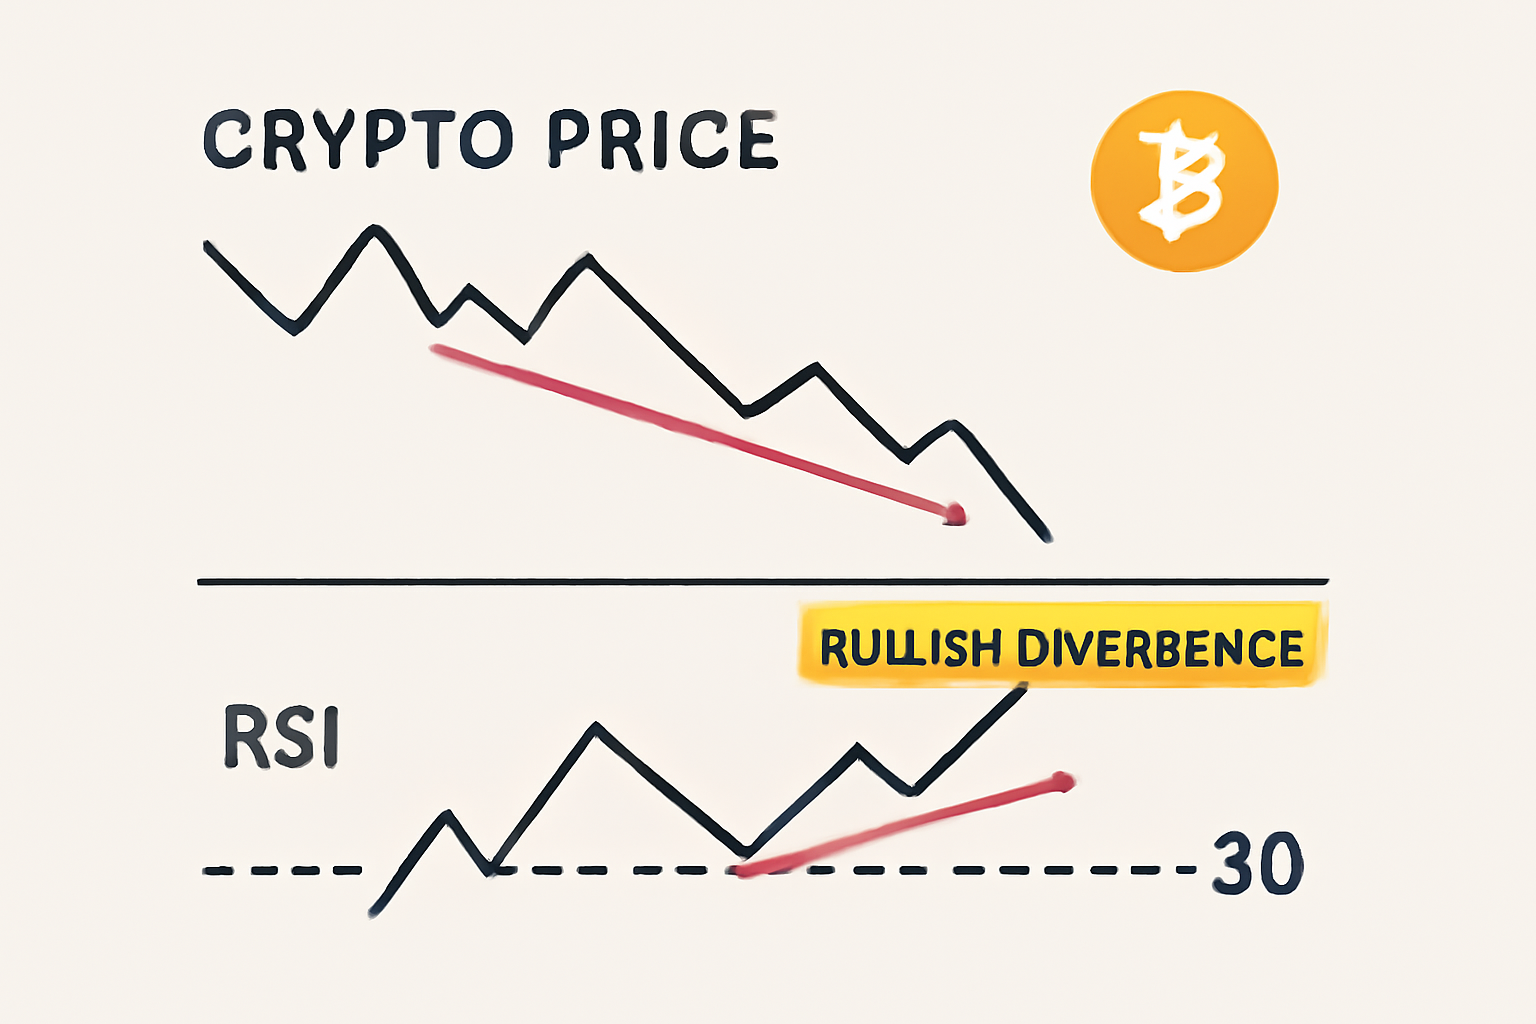
The most robust RSI signals occur when you spot bullish divergence: while price prints lower lows, the RSI forms higher lows. This pattern suggests that bearish momentum is waning even as price continues to drop - an early warning of a potential trend shift. Still, using RSI alone is not enough; it must be corroborated with other signs for higher conviction.
Major Historical Support Level: Foundation for Reversal
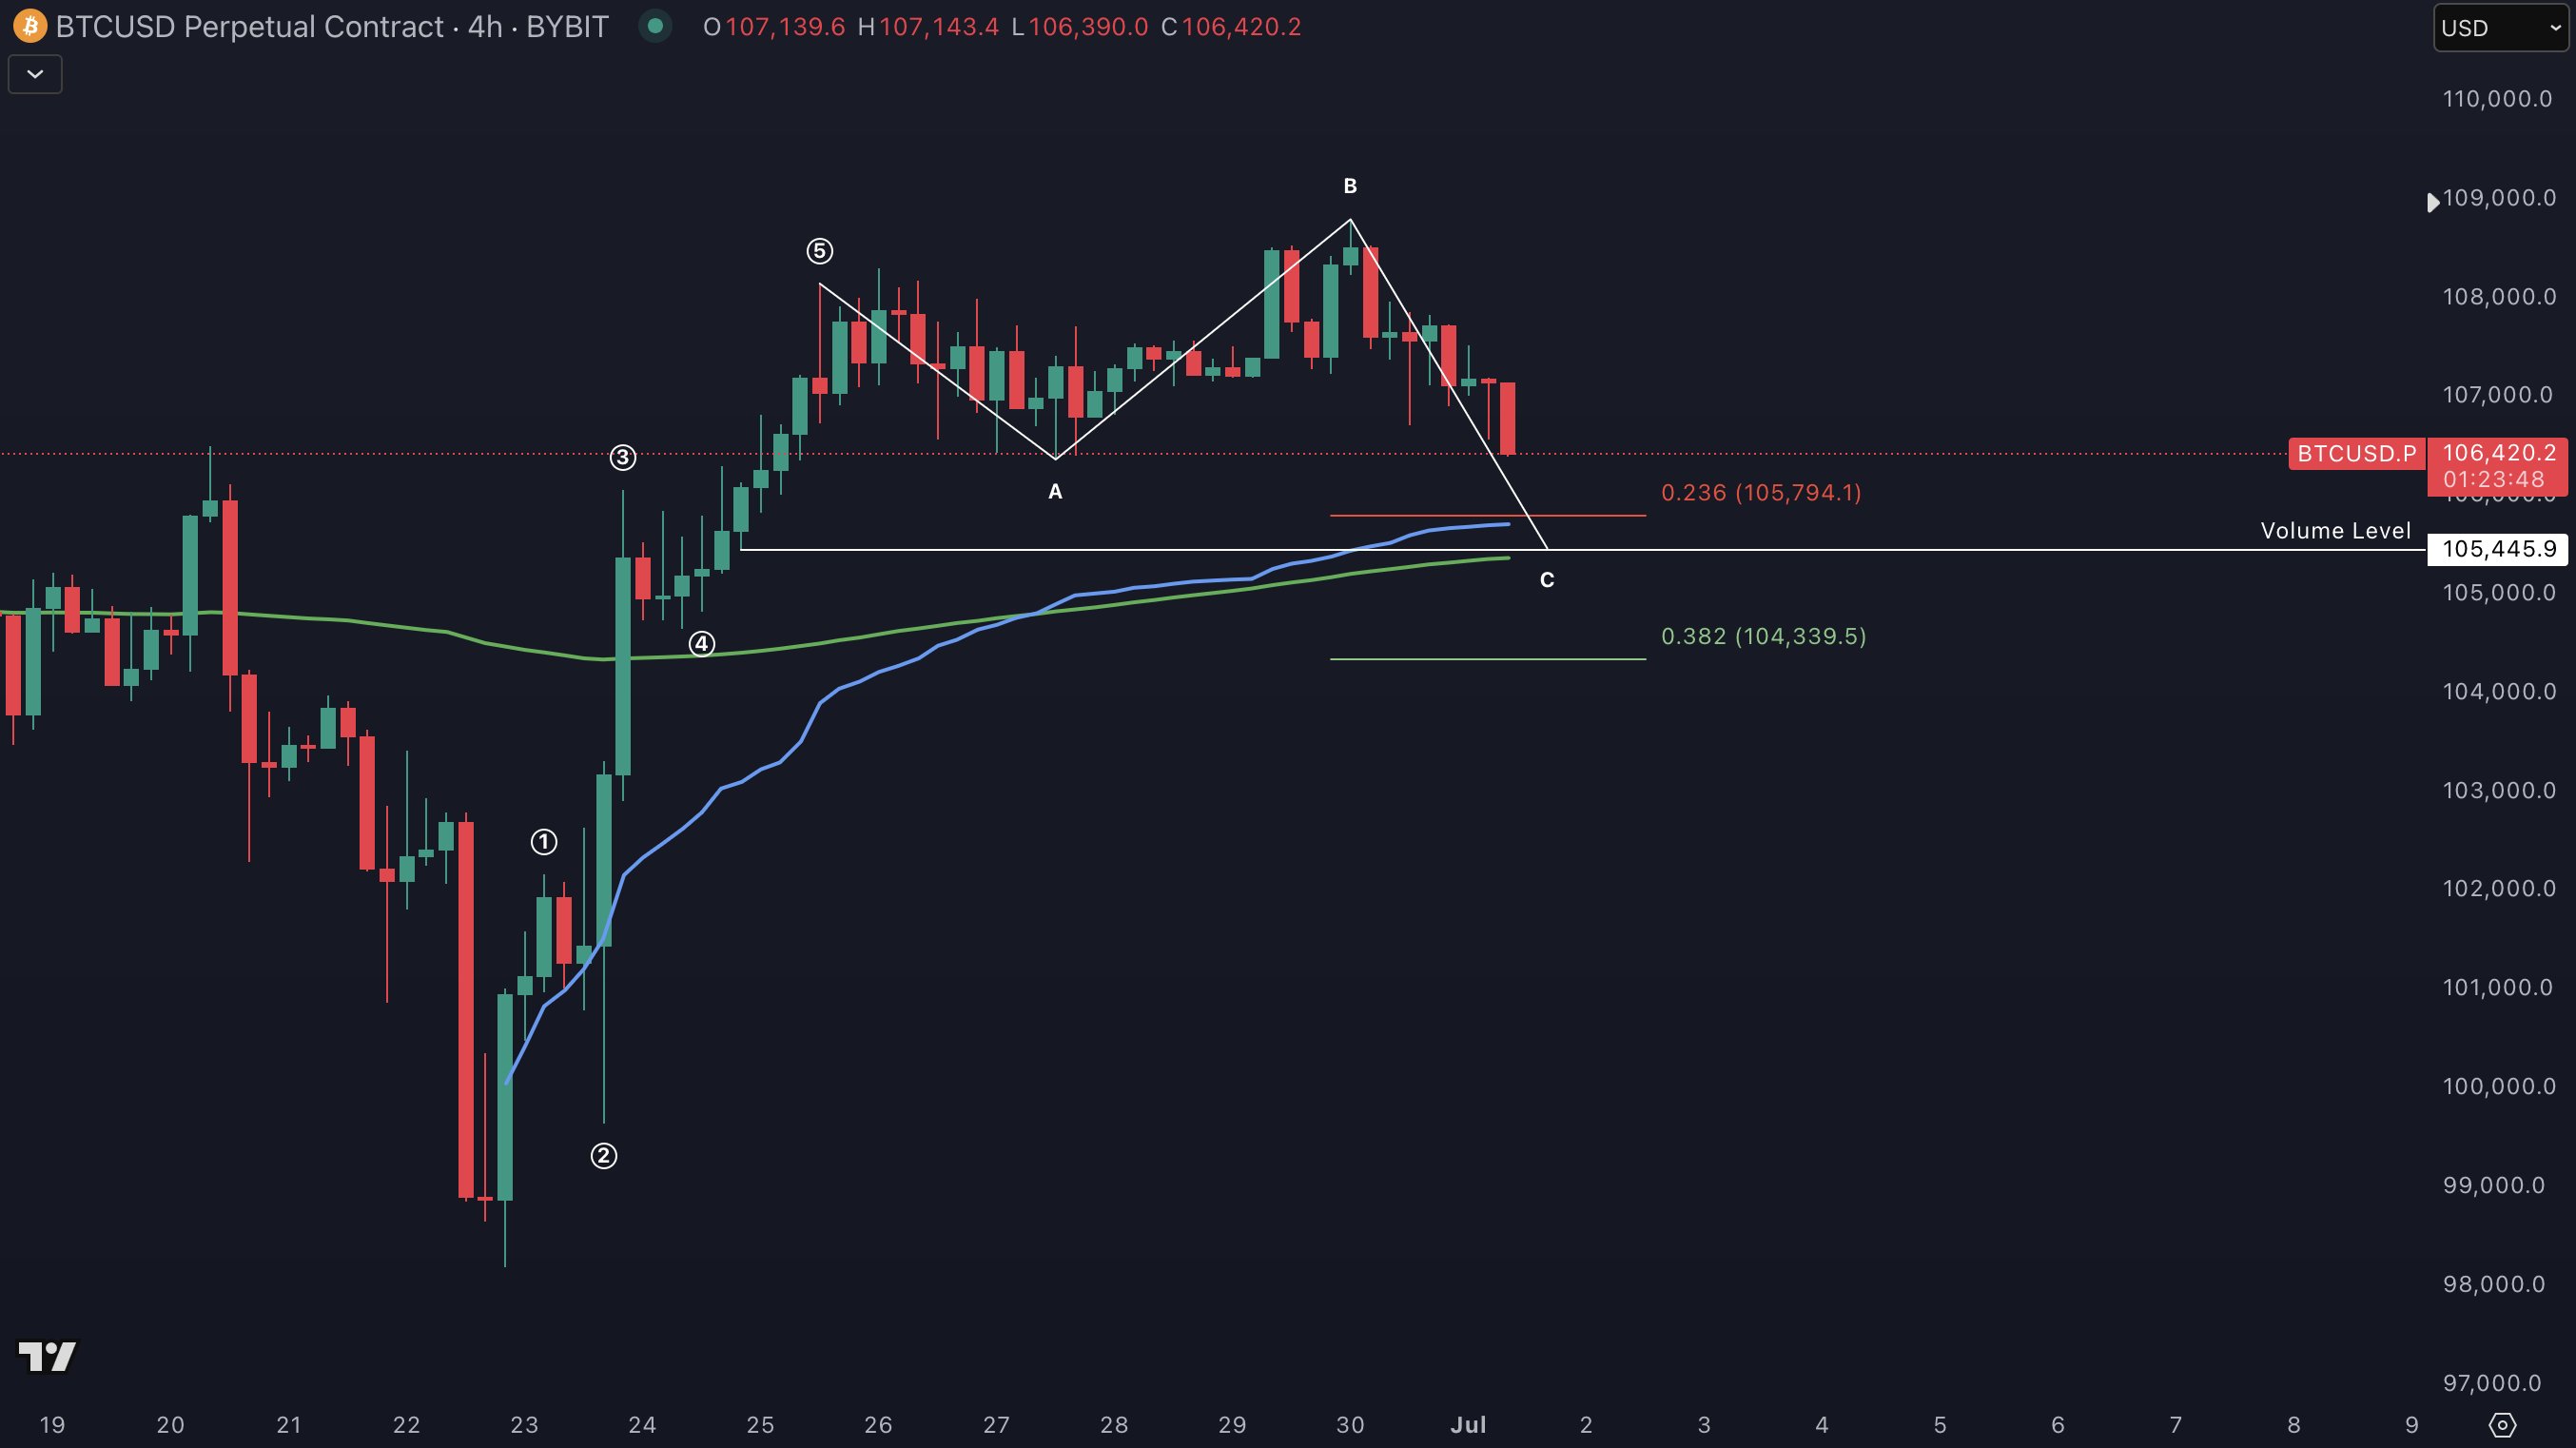
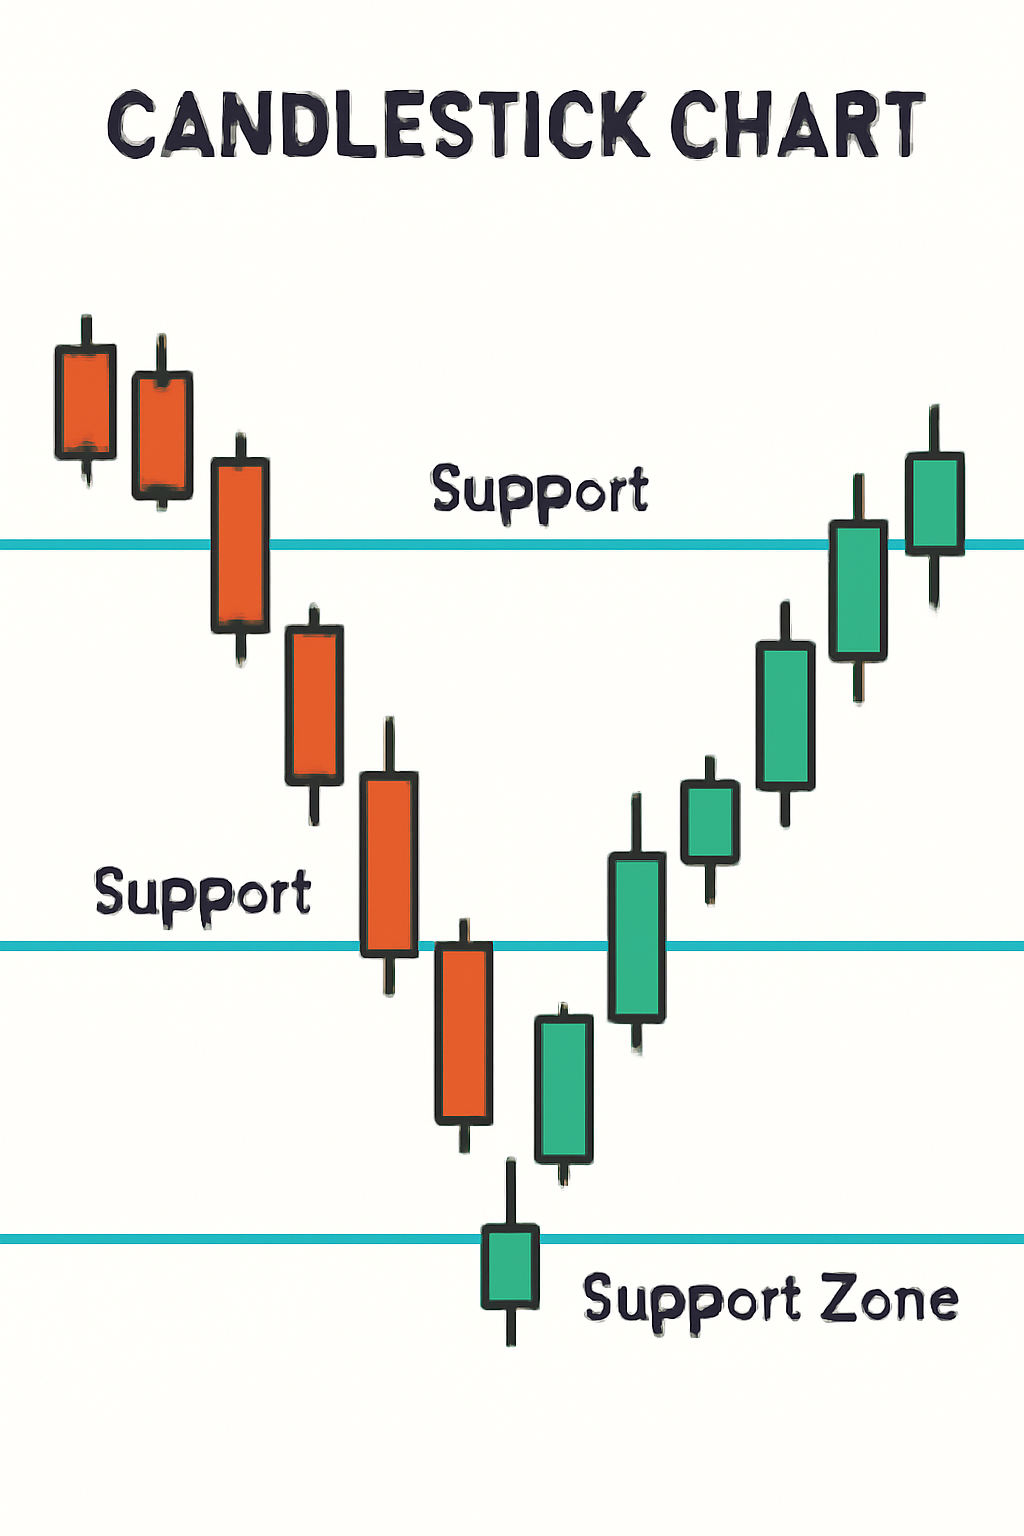
Support levels represent areas where buyers have historically stepped in to halt declines. These are typically drawn based on previous swing lows or zones where price has consolidated before rebounding over several months. When crypto assets approach these established supports - especially after prolonged declines - market participants closely watch for signs of stabilization or reversal.
A true test comes when price touches or slightly breaches these major historical support levels and then shows signs of holding firm or bouncing back. If this coincides with an oversold RSI reading or bullish divergence, it adds weight to the case for a developing bottom.
Liquidity Sweep Event: Spotting Smart Money Moves
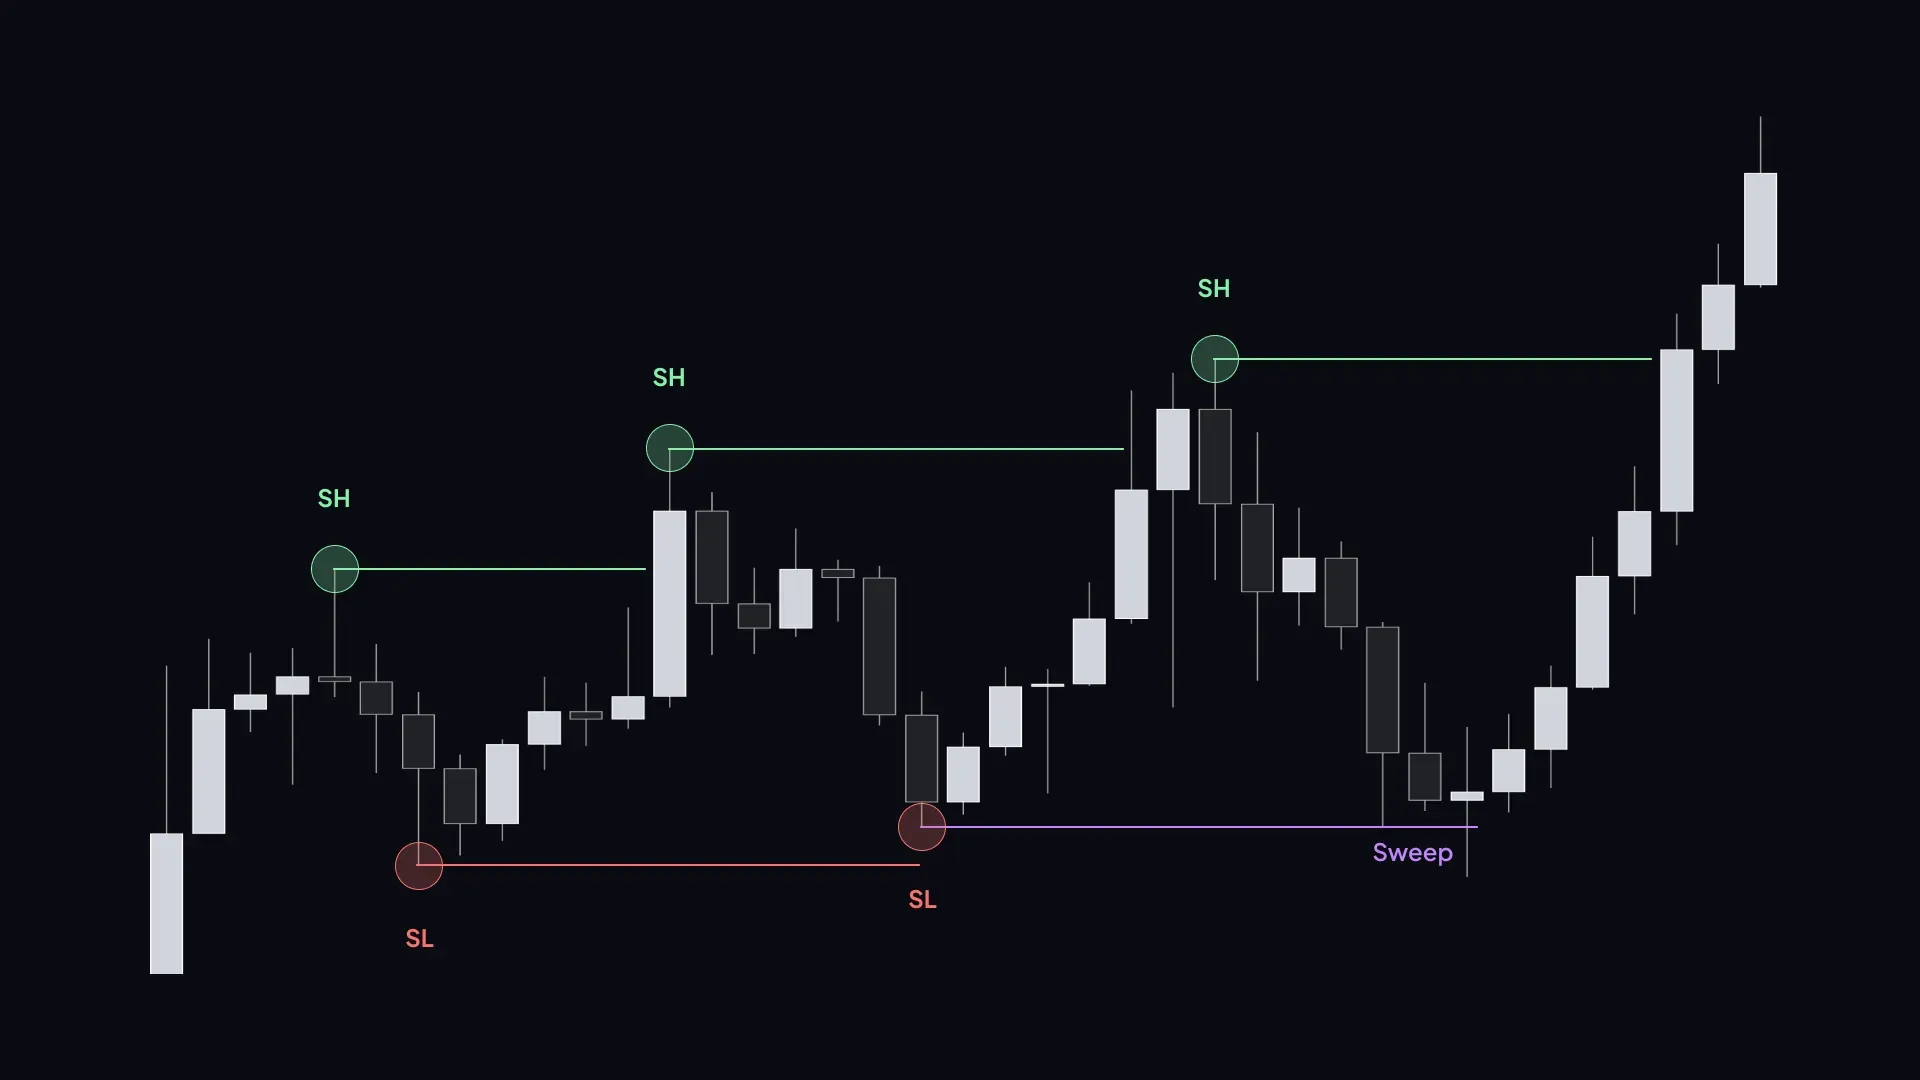
Liquidity sweeps are sophisticated maneuvers often executed by institutional players seeking to fill large orders with minimal slippage. Here’s how they work: after identifying an area loaded with stop-losses just below support, large traders will deliberately push prices below this level - triggering those stops and creating a spike in selling volume.
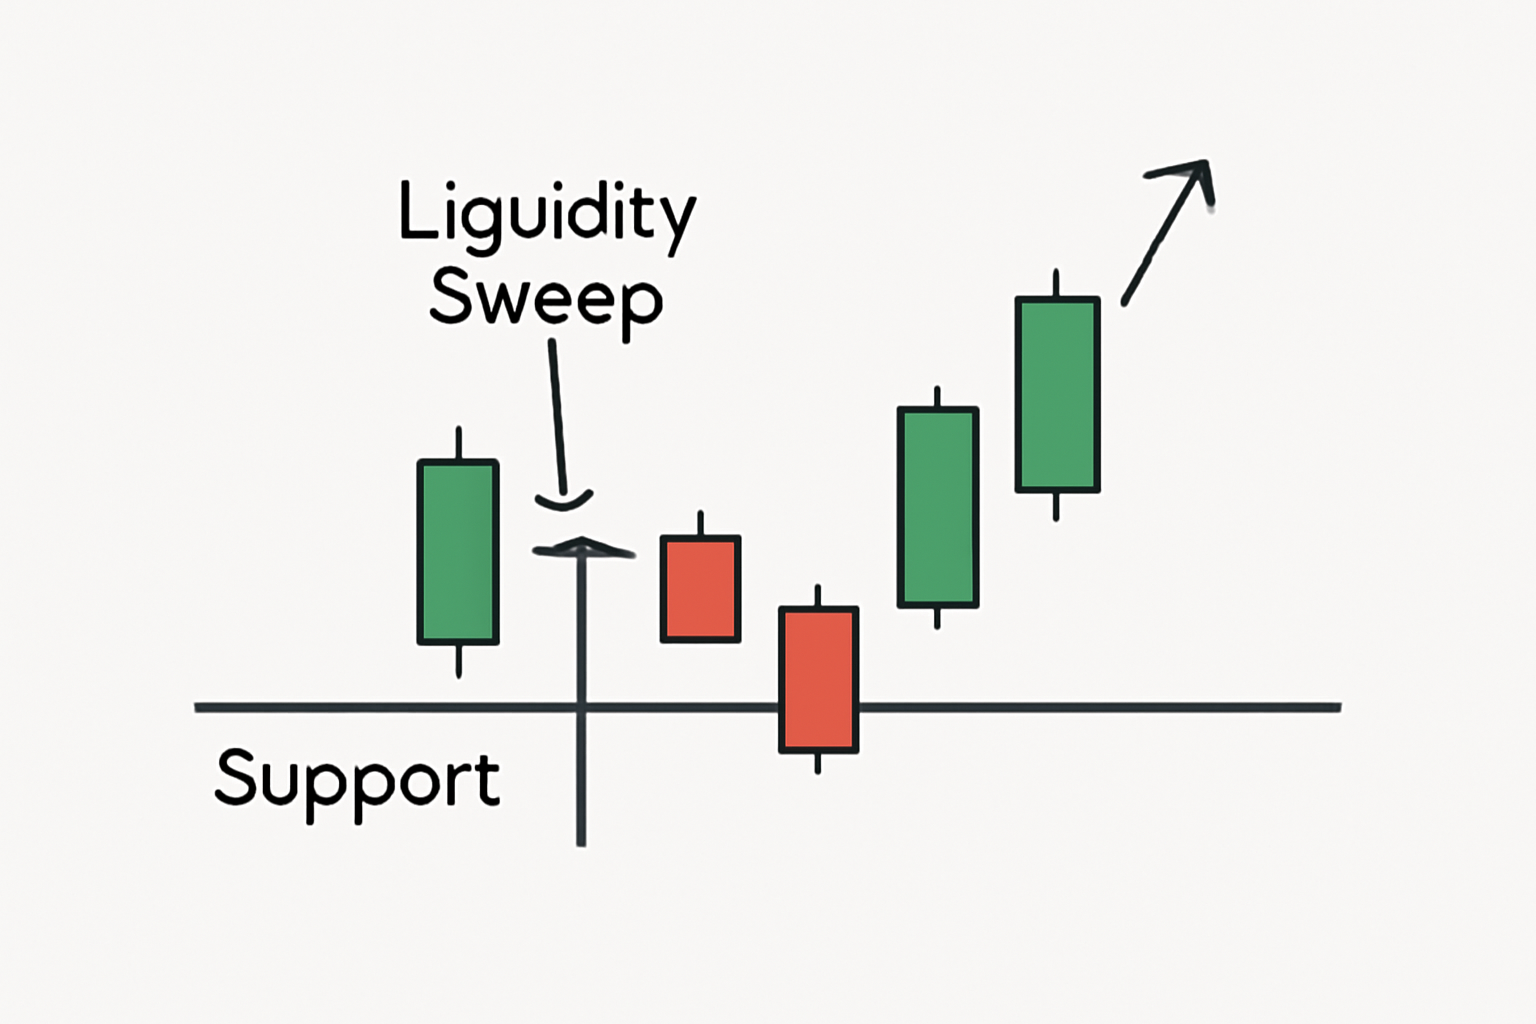
This results in a sharp wick beneath support (a classic liquidity sweep event), followed by rapid price recovery as smart money absorbs the forced selling from retail traders’ stops being hit. Recognizing these patterns takes practice but can provide clear evidence that "weak hands" have been flushed out and accumulation by larger players has begun.
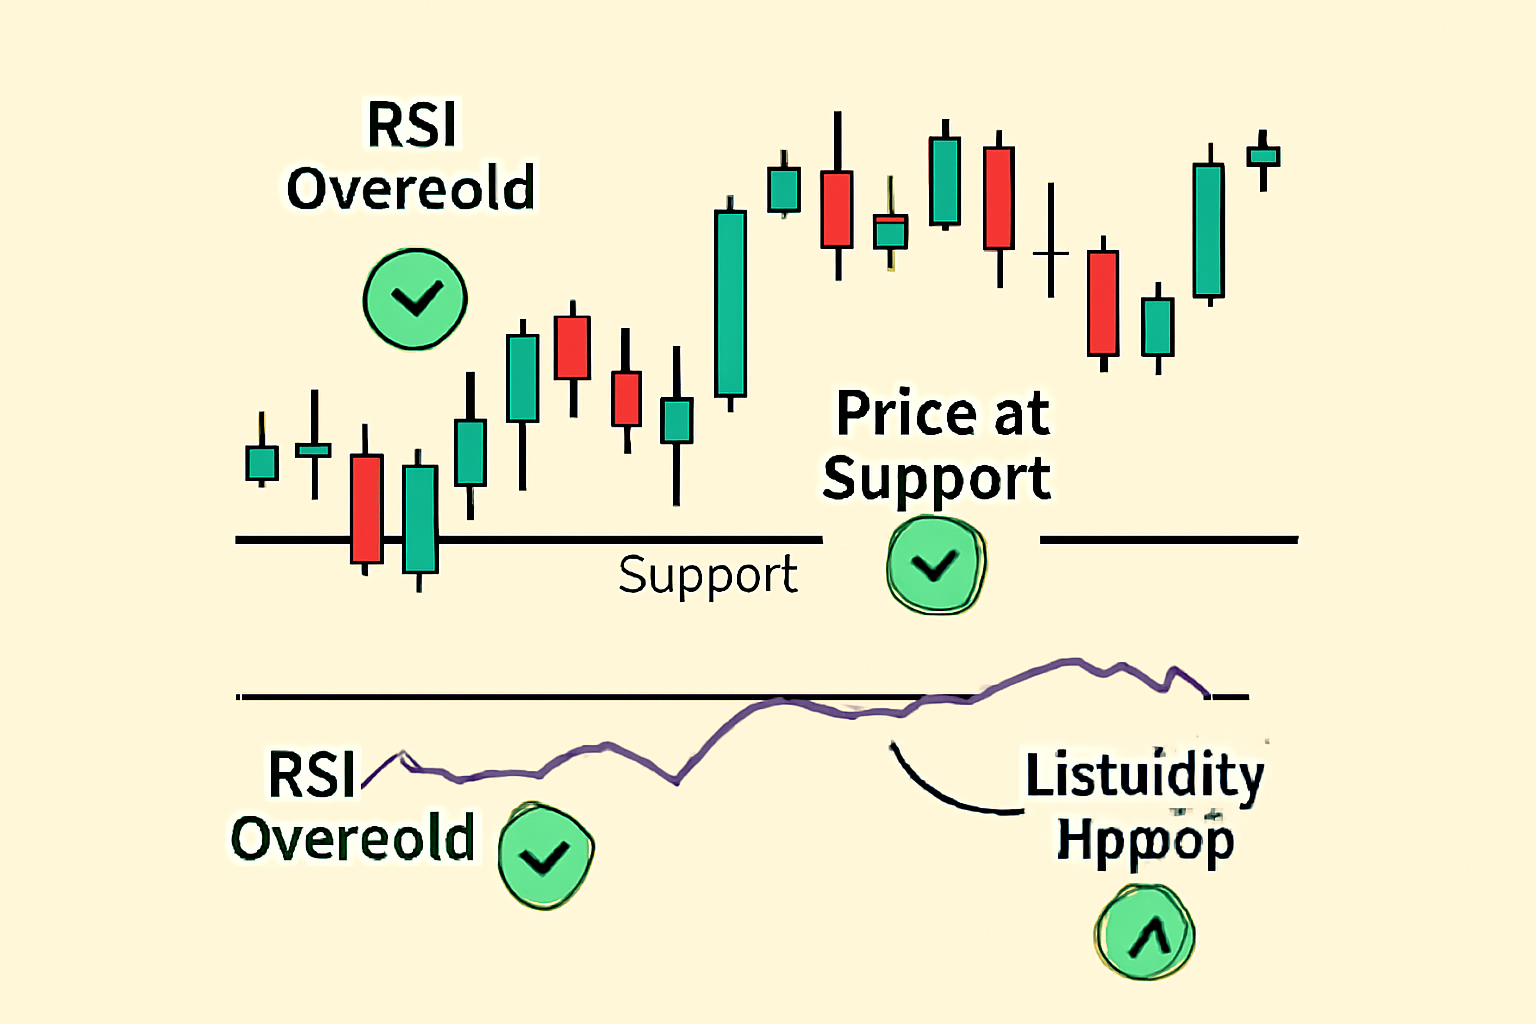
When all three indicators align, an RSI oversold signal, a test or bounce from a major historical support level, and a visible liquidity sweep event: the probability of a market bottom increases significantly. However, it is crucial to remain methodical and avoid emotional decisions. Each signal should be confirmed on higher timeframes for added reliability, and traders should always consider the broader market context, including macroeconomic factors and overall sentiment.
3 Key Indicators of Crypto Market Bottoms
- RSI Oversold Signal: When the Relative Strength Index (RSI) drops below 30, it signals that the asset is in oversold territory, potentially indicating a reversal zone. Look for bullish divergence—where price makes lower lows but RSI forms higher lows—for a stronger confirmation of a bottom.
- Major Historical Support Level: A market bottom often forms when price tests or bounces from a well-established multi-month support level. These are price zones where buyers have previously stepped in, preventing further declines and often leading to a reversal.
- Liquidity Sweep Event: This occurs when price makes a sharp wick below support, triggering stop-losses and capturing liquidity, followed by a rapid price recovery. Such events are frequently orchestrated by institutional traders and can signal a strong reversal point.
Practical Application: Building Your Bottom-Finding Toolkit
Let’s walk through an actionable approach for integrating these crypto market bottom indicators into your trading strategy:
Step-by-Step Guide: Identifying Crypto Market Bottoms with RSI, Support, and Liquidity Sweeps
Step 1: Begin by scanning for assets where the RSI is below 30. This flags potential candidates experiencing heavy selling pressure.
Step 2: Overlay major historical support levels on your chart. Focus on areas where price has previously rebounded over at least several months.
Step 3: Watch for price action that briefly pierces below these supports with a sharp wick, the hallmark of a liquidity sweep event. Look for rapid recovery afterward as evidence of smart money stepping in.
Step 4: Confirm with volume analysis; spikes during or immediately after the liquidity sweep suggest strong participation by larger players.
Step 5: Only consider entries when at least two out of these three signals are present. The highest conviction setups occur when all three align.
This disciplined approach helps reduce false positives and emotional trades. Remember that no indicator is infallible; risk management remains paramount. Use stop-losses just below the recent liquidity sweep wick to minimize downside if the reversal fails to materialize.
Common Pitfalls to Avoid
- Avoid acting on RSI alone. Oversold conditions can persist in strong downtrends without signaling an imminent reversal.
- Don’t ignore volume. Lack of significant volume during a supposed liquidity sweep may indicate insufficient institutional interest.
- Avoid chasing price after sharp recoveries. Wait for confirmation, a retest or consolidation above support can provide safer entries.
The synergy between these indicators provides RSI oversold readings, bounces from major historical support levels, and witnessed liquidity sweeps with swift recoveries: offers a robust framework for timing crypto market entry. While no method guarantees perfect results, this multi-pronged approach helps stack probabilities in your favor, allowing you to act decisively when opportunity arises.


No comments yet. Be the first to share your thoughts!