
The current market landscape is a stress test for even the most seasoned crypto traders. As of November 4,2025, Bitcoin (BTC) is trading at $101,300, down 5.18% in the past 24 hours, while Ethereum (ETH) has dropped to $3,302.51, an 8.88% slide. These sharp moves are unfolding against a backdrop of falling equities: the SPDR S and P 500 ETF Trust (SPY) is at $675.77 (-1.11%) and the Invesco QQQ Trust Series 1 (QQQ) sits at $620.93 (-1.76%). The message is clear: crypto and stock markets are more correlated than ever during periods of economic uncertainty. For investors, this presents both risk and opportunity.

Why Crypto Traders Can’t Ignore Stock Market Drops
Historically, Bitcoin was pitched as a non-correlated asset – digital gold immune to Wall Street’s swings. But in recent years, macroeconomic shocks have shown that crypto often moves in tandem with stocks during global selloffs. This means that when equity markets tumble, crypto portfolios can experience amplified volatility.
If you’re trading crypto during stock market drops, it’s essential to employ strategies tailored for high-volatility environments. Below I’ll break down five actionable strategies to help you protect capital and identify opportunities when both traditional and digital assets are under pressure.
Implement Strict Risk Management and Avoid Panic Selling
Panic selling is the enemy of long-term wealth creation. When markets drop sharply – like today’s double-digit losses in BTC and ETH – fear can override rational decision-making. Instead of dumping assets into a falling market, set clear stop-loss levels before entering trades and stick to them without exception.
Consider position sizing as your first line of defense: never risk more than a small percentage of your portfolio on any single trade. Use limit orders rather than market orders to avoid slippage during high volatility spikes.
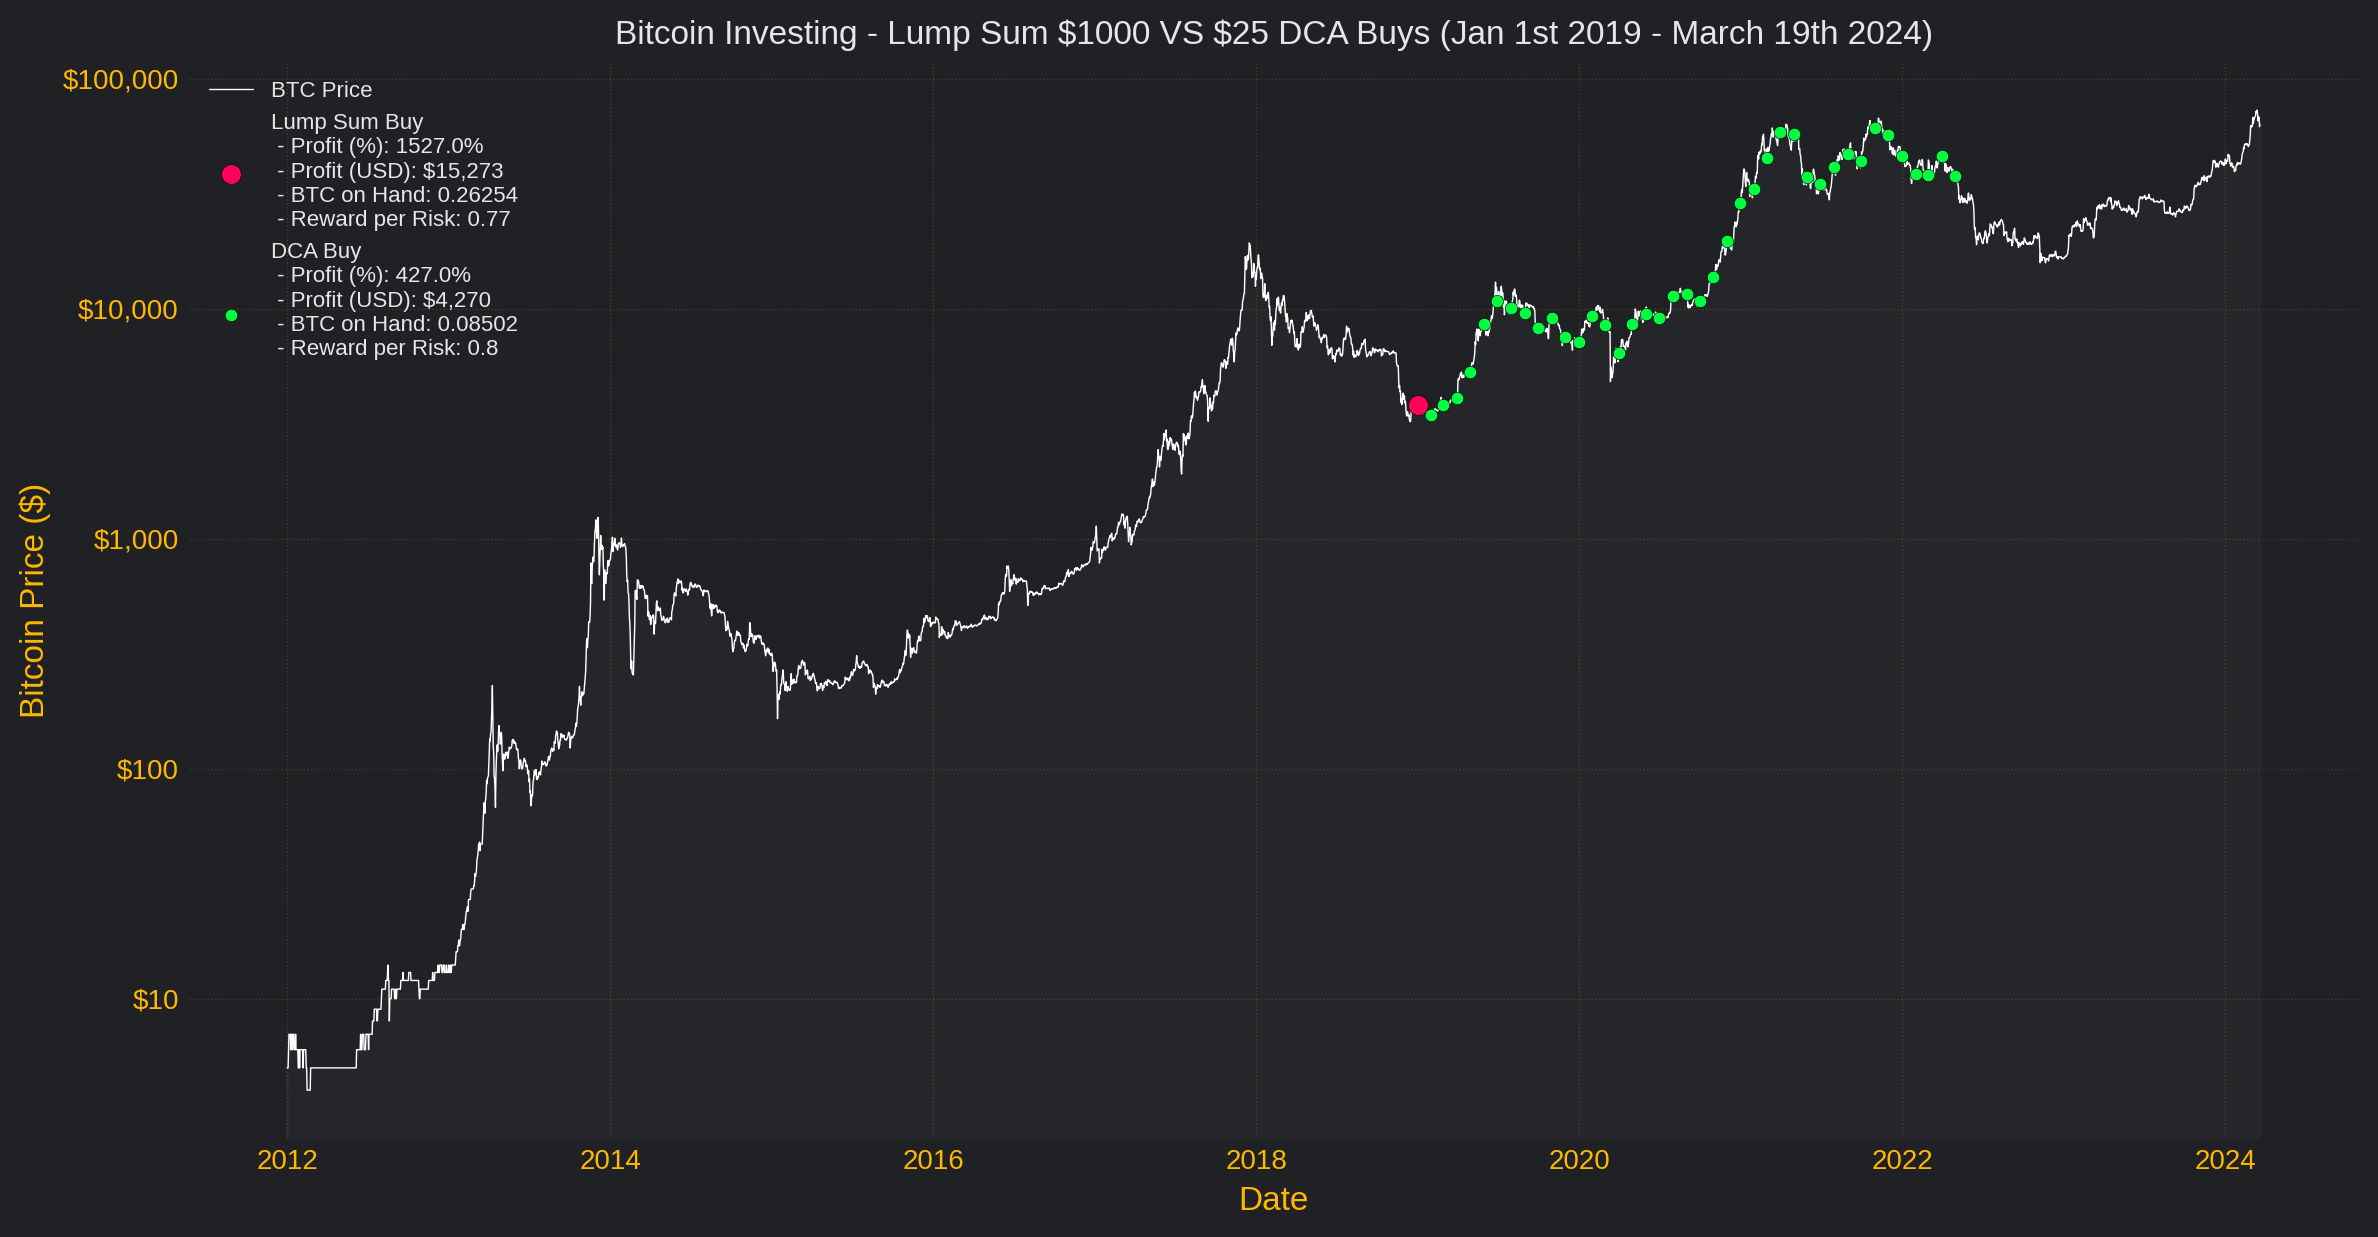
Smooth Your Entry Points with Dollar-Cost Averaging (DCA)
DCA remains one of the most effective ways to navigate turbulent markets. Instead of trying to time the exact bottom – an exercise that often leads to regret – allocate fixed amounts at regular intervals regardless of price action. This approach reduces emotional stress while lowering your average cost basis over time.
DCA is especially powerful when deployed during extended downturns like we’re witnessing now with BTC hovering just above $100,000 and ETH below $3,500. By spreading out your purchases across multiple sessions or weeks, you sidestep FOMO-driven decisions and avoid catching falling knives.
Diversify Across Uncorrelated Crypto Assets and Stablecoins
Diversification isn’t just for equities. Within crypto portfolios, holding assets that don’t move in lockstep can buffer against sharp drawdowns. For example, allocating some capital into stablecoins such as USDC or DAI provides dry powder for future opportunities while reducing overall volatility.
Don’t overlook layer-1 protocols or DeFi tokens with unique value propositions that may outperform Bitcoin or Ethereum during specific cycles. The key is having a plan: rebalance regularly based on performance rather than emotion-driven hunches.
Top 5 Crypto Trading Strategies for Market Drops
-

Implement Strict Risk Management and Avoid Panic SellingSet clear stop-loss orders and use portfolio tracking tools like CoinMarketCap Portfolio Tracker or CoinTracking. This helps you monitor positions and avoid emotional, impulsive trades during sharp downturns.
-
Utilize Dollar-Cost Averaging (DCA) to Smooth Entry PointsAutomate regular purchases of assets like Bitcoin (BTC) (currently $101,300) or Ethereum (ETH) (currently $3,302.51) using platforms such as Coinbase or Kraken, reducing the impact of short-term volatility.
-

Diversify Across Uncorrelated Crypto Assets and StablecoinsBalance your portfolio with assets like USDC or USDT (stablecoins), Ethereum, and alternative layer-1s such as Solana. Use platforms like Binance for broad asset access. This limits risk if one sector drops sharply.
-

Leverage Technical Analysis to Identify Support Levels and Trend ReversalsUtilize charting tools like TradingView to spot key support/resistance zones and trend reversal patterns, helping you make informed entry and exit decisions.
-

Harvest Tax Losses and Consider Staking or Yield StrategiesOffset gains by selling underperforming assets for a tax loss, then explore staking options on platforms like Lido or Kraken Staking to earn passive income during downturns.
What’s Next for BTC and ETH? Near-Term Predictions
Bitcoin (BTC) Price Prediction Table: 2026-2031
Professional outlook based on late-2025 bear market conditions, macroeconomic trends, and evolving crypto strategies
| Year | Minimum Price | Average Price | Maximum Price | % Change (Avg, YoY) | Market Scenario |
|---|---|---|---|---|---|
| 2026 | $80,000 | $98,500 | $120,000 | -2.8% | Continued volatility, potential for further downside if macro headwinds persist |
| 2027 | $85,000 | $110,000 | $145,000 | +11.7% | Possible recovery phase, adoption growth resumes, regulatory clarity improves |
| 2028 | $100,000 | $128,000 | $170,000 | +16.4% | Bullish sentiment returns; institutional entry and halving effects |
| 2029 | $110,000 | $142,000 | $200,000 | +10.9% | Expansion cycle, new ATHs possible if global adoption accelerates |
| 2030 | $120,000 | $160,000 | $240,000 | +12.7% | Wider use cases, improved scalability, and mainstream integration |
| 2031 | $130,000 | $175,000 | $270,000 | +9.4% | Mature market, steady growth, potential regulatory harmonization |
Price Prediction Summary
Bitcoin is expected to navigate a challenging macro environment in the near term, with significant volatility and risk of further downside into 2026. As the market digests economic uncertainty and regulatory developments, gradual recovery is likely from 2027 onwards, aided by adoption trends, technological improvements, and the next Bitcoin halving. By 2031, BTC could reach a mature phase with higher but steadier price growth, though large swings remain possible given global economic and policy shifts.
Key Factors Affecting Bitcoin Price
- Macroeconomic trends and stock market correlation, especially during global downturns
- Regulatory clarity and global policy harmonization
- Technological advancements (e.g., Lightning Network, Layer 2 solutions)
- Institutional adoption and capital inflows
- Upcoming Bitcoin halving cycles
- Competition from other cryptocurrencies (ETH, altcoins)
- Market sentiment, retail investor participation, and psychological price levels
Disclaimer: Cryptocurrency price predictions are speculative and based on current market analysis.
Actual prices may vary significantly due to market volatility, regulatory changes, and other factors.
Always do your own research before making investment decisions.
If you want deeper insight into how traditional market instability impacts cryptocurrencies over time – including lessons from previous downturns – see our comprehensive analysis at this link.
Leverage Technical Analysis to Identify Support Levels and Trend Reversals
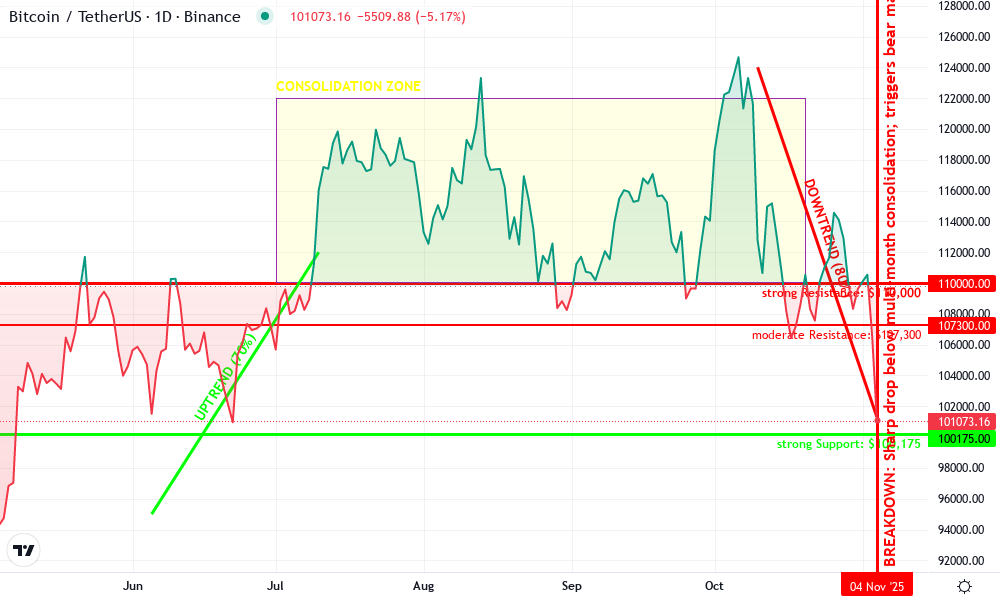
In times of heightened volatility, technical analysis becomes a trader’s compass. With Bitcoin currently at $101,300 and Ethereum at $3,302.51, price action is swift and often unpredictable. Instead of guessing market bottoms or tops, use charting tools to spot key support zones, historical price levels where buying interest has previously emerged. For example, if BTC repeatedly bounces near the $100,000 mark, that’s a signal to watch.
Trend reversal indicators, such as Relative Strength Index (RSI) oversold readings or bullish divergence on the MACD, can offer early clues that selling pressure is waning. However, in bear markets these signals are less reliable, wait for confirmation through volume spikes or multiple timeframe alignment before acting. Combine these technical cues with fundamental catalysts (like regulatory news or macro data) for a more holistic approach.
Bitcoin Technical Analysis Chart
Analysis by Marissa Chow | Symbol: BINANCE:BTCUSDT | Interval: 1D | Drawings: 7
Technical Analysis Summary
Draw a prominent horizontal support line at $100,175, marking the current 24h low, and another at $101,300 for real-time price monitoring. Place a resistance line at $107,300 (24h high) and $110,000 (recent range ceiling). Highlight the sharp breakdown below $105,000 with a vertical line and an arrow marker. Use a rectangle to shade the consolidation band between $110,000 and $122,000 from July through late October. Plot a downtrend line from the $124,000 October peak to the current price, with a confidence score of 0.8, and an earlier uptrend line from June lows to July highs (confidence 0.7). Annotate the breakdown as a ‘potential bear market trigger,’ and note the increased volatility using callouts near the steepest moves.
Risk Assessment: high
Analysis: Volatility is elevated, key support is under threat, and broader macro risk-off sentiment persists. The technical break down from consolidation increases the probability of further downside unless $100,000 holds.
Marissa Chow’s Recommendation: Reduce position sizing, avoid leverage, and stick to DCA or accumulation strategies only at confirmed support. Wait for stabilization or reversal volume signals before aggressive re-entry.
Key Support & Resistance Levels
📈 Support Levels:
-
$100,175 – 24h low and immediate psychological support—critical for near-term direction.
strong
📉 Resistance Levels:
-
$107,300 – 24h high and local resistance from previous intraday bounce.
moderate -
$110,000 – Ceiling of recent consolidation band; likely to cap rallies in near term.
strong
Trading Zones (medium risk tolerance)
🎯 Entry Zones:
-
$100,200 – Potential bounce from $100,000 psychological support and 24h low for DCA or tactical long.
medium risk
🚪 Exit Zones:
-
$107,300 – First resistance and possible profit-taking zone on any rebound.
💰 profit target -
$99,100 – Breakdown below $100,000 would invalidate support and trigger stop-loss discipline.
🛡️ stop loss
Technical Indicators Analysis
📊 Volume Analysis:
Pattern: Assumed spike on breakdown, suggesting capitulation or panic selling.
High volume likely accompanied today’s sharp drop, indicating strong selling interest. Watch for volume tapering as a potential reversal cue.
📈 MACD Analysis:
Signal: Bearish crossover likely as price momentum accelerates downward.
MACD (if overlaid) would likely show a strong bearish signal, in line with price action. Await positive divergence before considering counter-trend entries.
Applied TradingView Drawing Utilities
This chart analysis utilizes the following professional drawing tools:
Disclaimer: This technical analysis by Marissa Chow is for educational purposes only and should not be considered as financial advice.
Trading involves risk, and you should always do your own research before making investment decisions.
Past performance does not guarantee future results. The analysis reflects the author’s personal methodology and risk tolerance (medium).
Harvest Tax Losses and Consider Staking or Yield Strategies
Periods of portfolio decline can be reframed as opportunities for tax-loss harvesting. If you’re holding assets below your purchase price, realize those losses to offset gains elsewhere, potentially reducing your overall tax bill when markets recover. This strategy is especially relevant after sharp declines like today’s 5% and drop in BTC and nearly 9% slide in ETH.
Meanwhile, instead of letting idle assets languish in your wallet, explore staking and yield-generating protocols. Many proof-of-stake tokens allow you to earn rewards even during downtrends, helping cushion drawdowns with passive income. For stablecoins parked on reputable DeFi platforms, yields can be attractive without direct market exposure. Just remember: vet protocols for security risks before allocating capital.
Putting It All Together: A Checklist for Volatile Markets
The crypto landscape will always be volatile, but with discipline and preparation you can turn chaos into opportunity. By combining strict risk controls with systematic DCA entries, diversifying across stablecoins and uncorrelated assets, using technical analysis judiciously, and optimizing your tax position through loss harvesting or staking yields, you’re positioned not just to survive market drops but potentially thrive when the tide turns.
If you’re seeking more cross-market context or want to understand how previous equity crashes have shaped crypto cycles, including what’s different this time, check out our deep dive at this resource.