

In the fast-evolving world of crypto trading, understanding volume analysis and monitoring whale activity can set your strategy apart. These two factors offer a window into market sentiment and potential price movements, helping traders anticipate shifts before they become headline news. As the landscape grows more sophisticated, integrating these signals is no longer optional for those seeking an edge in predicting crypto price movement.

Decoding Trading Volume: The Pulse of Crypto Markets
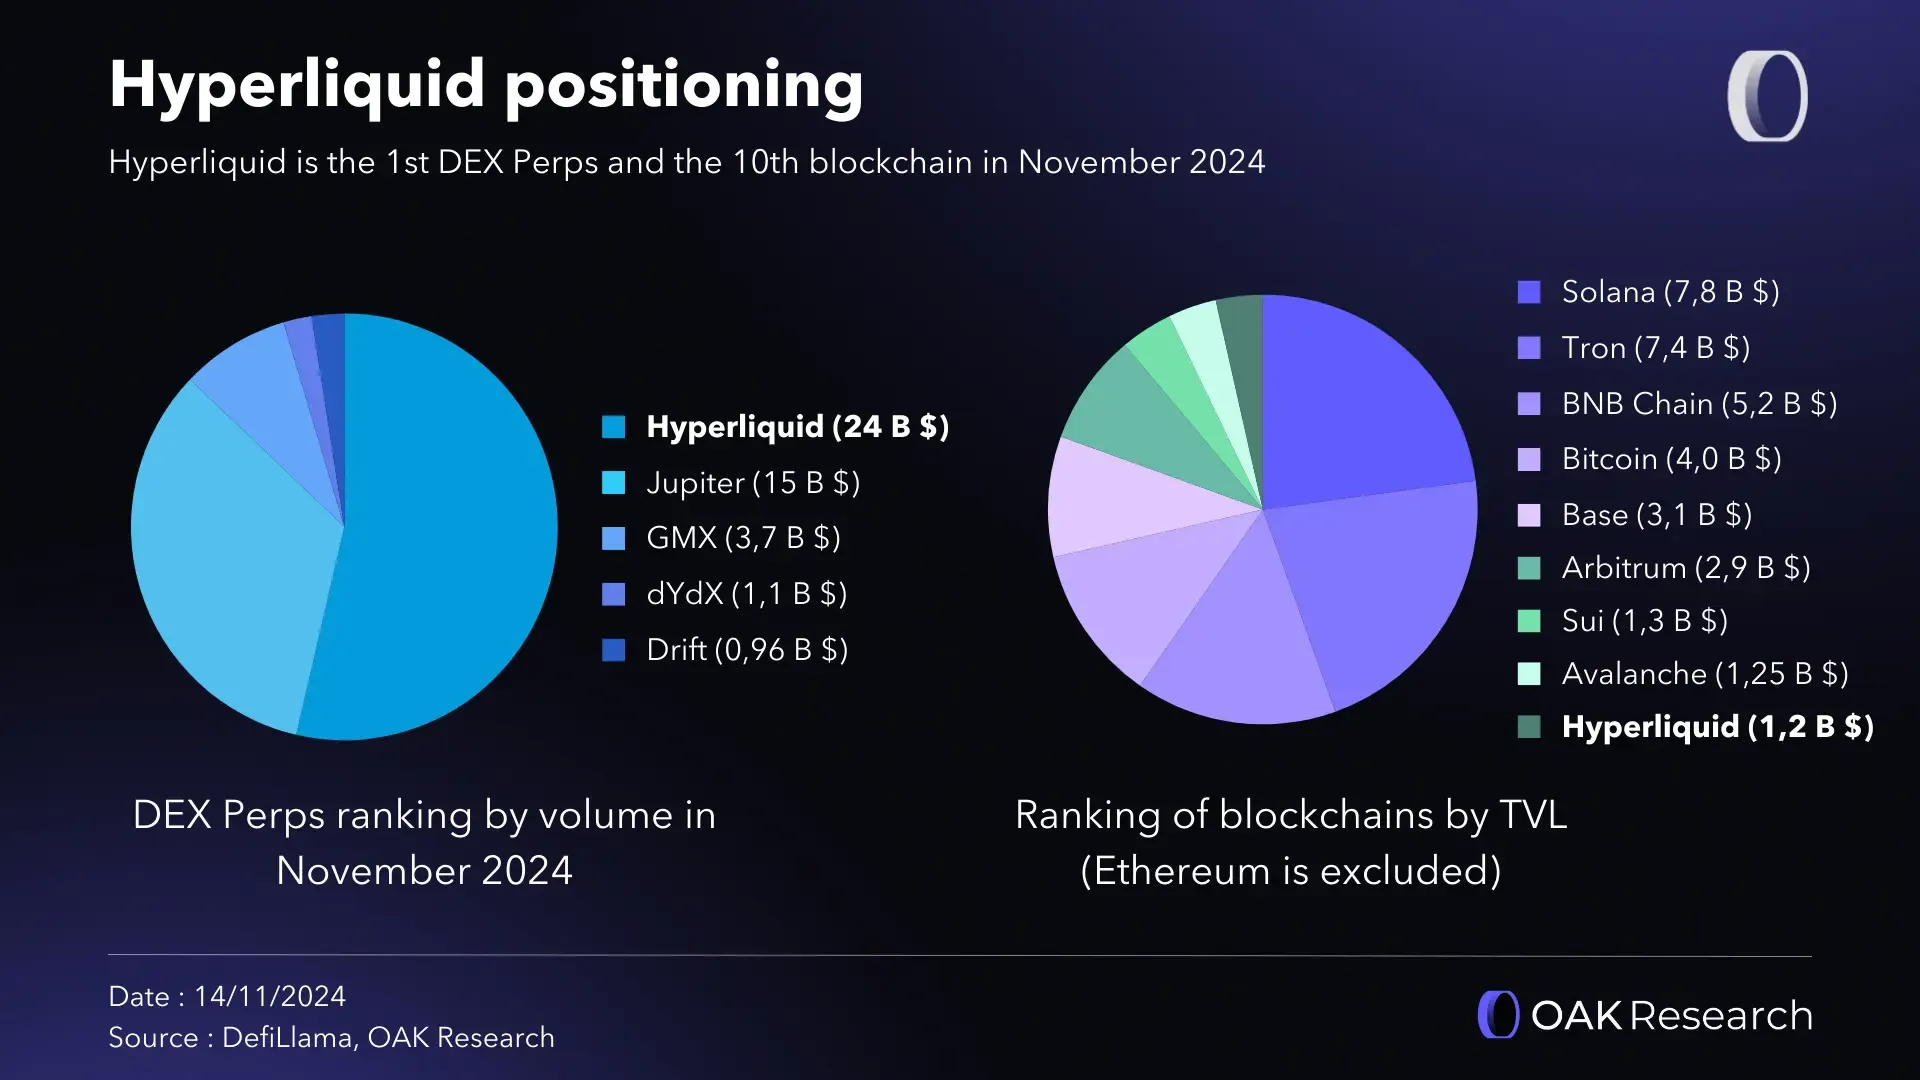
Trading volume is more than just a number; it’s the heartbeat of every cryptocurrency market. It represents the total amount of a specific asset traded within a given timeframe, and sudden spikes or drops often precede significant price changes. For example, when Hyperliquid (HYPE) experienced a surge in trading volume ahead of a major ecosystem shift, this spike signaled to sharp-eyed traders that a substantial move was likely imminent (source).
A high trading volume typically indicates robust interest and liquidity, making it easier for large transactions to occur without dramatic slippage. Conversely, low volume can mean the market is vulnerable to manipulation by large players - especially whales.
5 Real-World Volume Spikes Preceding Major Crypto Moves
- Hyperliquid (HYPE) Volume Surge Before Ecosystem Shift: In late September 2025, Hyperliquid (HYPE) experienced a sharp increase in trading volume ahead of a major ecosystem update. This spike signaled heightened market interest and preceded a significant price move, as large holders repositioned in anticipation of the changes.
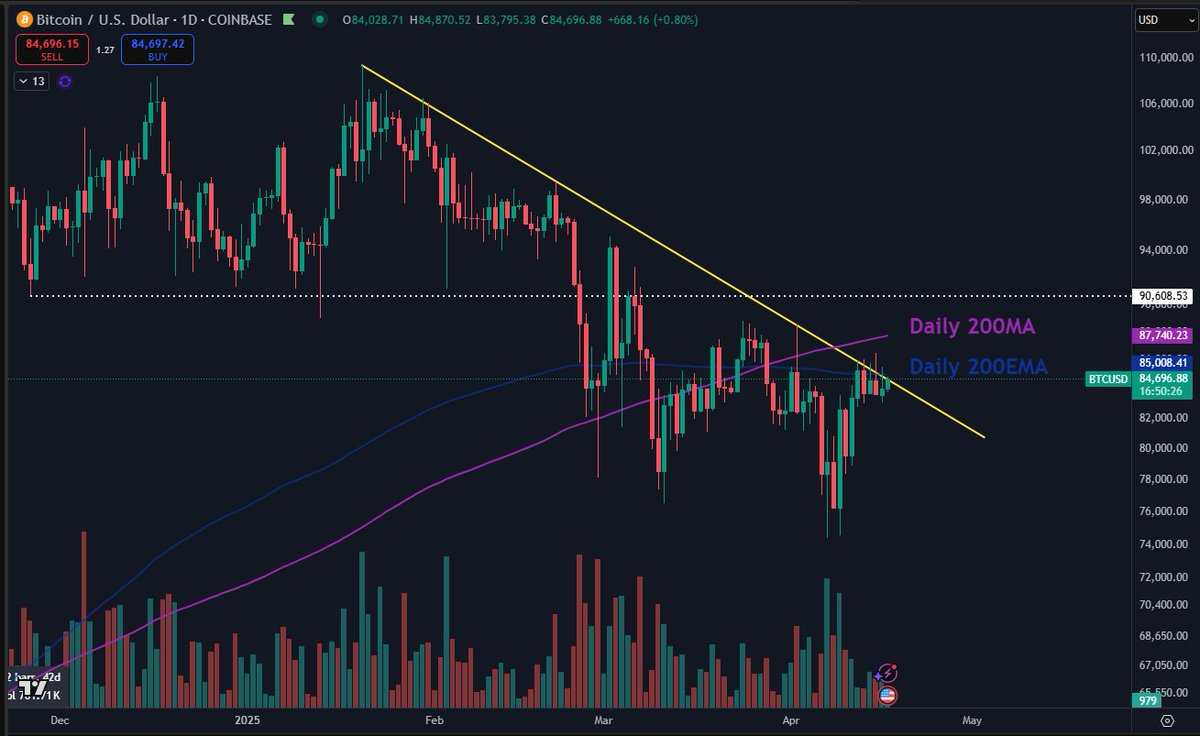
- Bitcoin Whale Accumulation and Volume Spike (April 2025): According to Santiment data, a notable surge in Bitcoin trading volume, coupled with increased on-chain whale accumulation, was observed in April 2025. This activity foreshadowed a strong upward price movement as large investors entered the market.
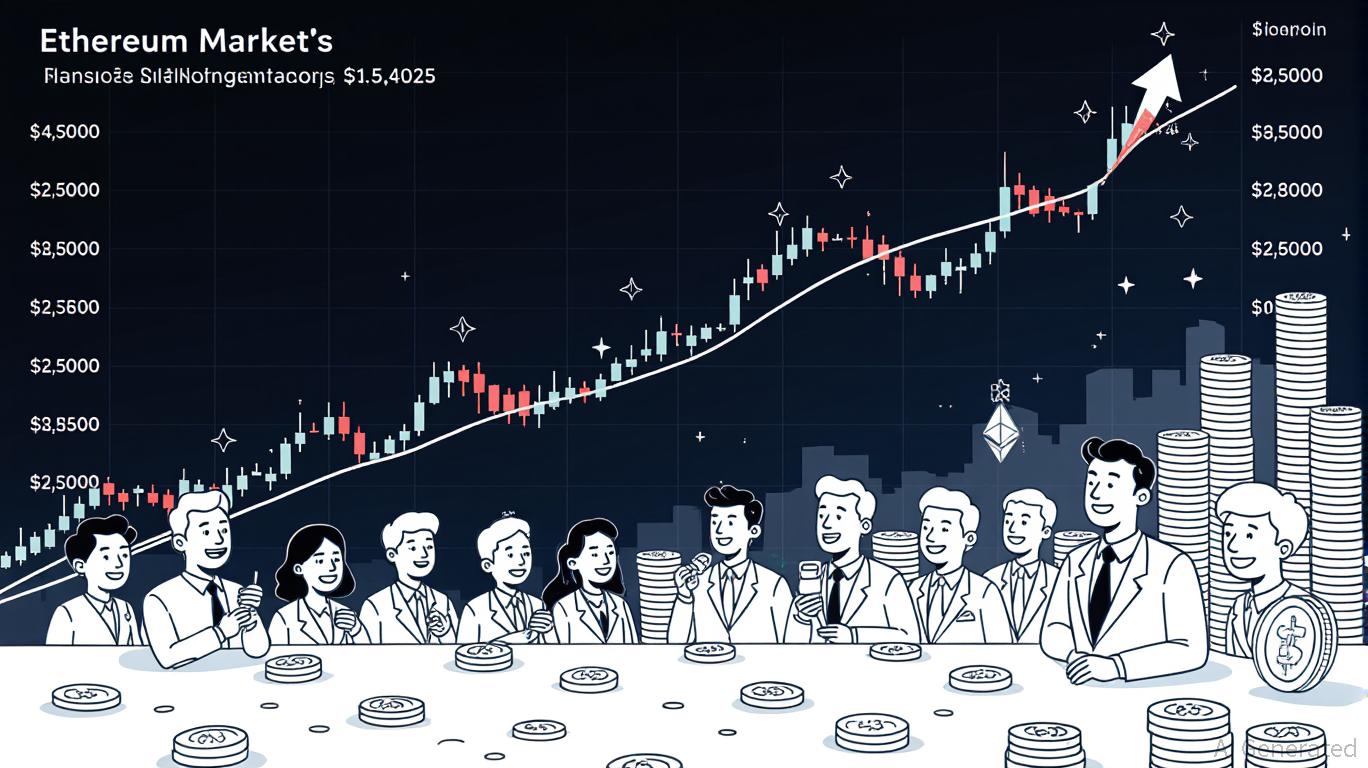
- Ethereum Whale Transactions Preceding Price Rally: In Q2 2025, Ethereum saw a significant uptick in large on-chain transactions (over $100K), as reported by CryptoNews. The accompanying spike in trading volume was an early indicator of a subsequent price rally, driven by whale accumulation.
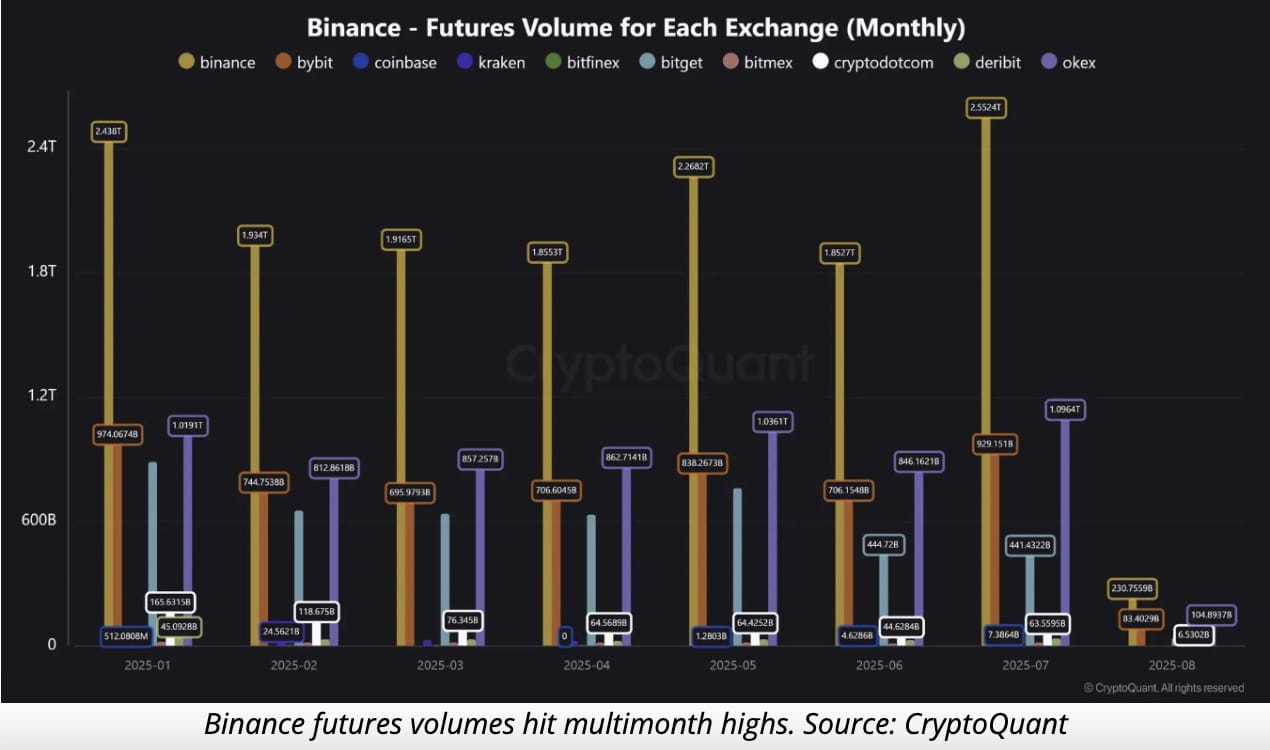
- Order Book Buy Wall on Binance Signals Altcoin Surge: In mid-2025, traders observed a massive buy wall on Binance for a leading altcoin, as detailed by Bitrue. The sudden increase in trading volume and visible whale support in the order book preceded a sharp price breakout.
- Multi-Altcoin Whale Accumulation Detected by On-Chain Analytics: In 2025, several major altcoins experienced simultaneous spikes in trading volume, with on-chain analytics platforms like Nansen highlighting increased whale transactions. This coordinated activity often led to notable price increases across the altcoin market.

The Power of Whale Activity in Crypto Trading Strategies
Crypto whales, or entities holding vast amounts of digital assets, have an outsized impact on price action. Their moves are closely watched because even a single transaction from a whale wallet can ripple through the entire market. According to recent on-chain data analysis, significant whale accumulation in Bitcoin and Ethereum has historically foreshadowed price rallies (source).
Their influence isn’t limited to spot markets. By placing large buy or sell walls on order books, whales can signal confidence or attempt to suppress prices for reaccumulation purposes (source). Recognizing these patterns is crucial for smart money trading strategies.
Tactics for Tracking Whales and Interpreting Volume Spikes
The modern trader has access to an array of tools designed specifically for tracking whale activity and analyzing trading volumes:
- On-chain Analytics Platforms: Services like Nansen and Santiment monitor blockchain transactions in real time, flagging transfers over $100K as potential whale moves.
- Volume Alert Systems: Platforms such as Cryptocurrency Alerting let you set custom notifications for unusual volume surges across top exchanges like Binance and Coinbase Pro.
- Order Book Monitoring: Regularly reviewing exchange order books helps identify strategic buy/sell walls placed by whales.
- AI-Powered Trackers: Some advanced bots now scan overnight whale movements exceeding $10M and analyze inflow/outflow patterns across exchanges.
The combination of these resources empowers traders to spot "smart money" trends early - whether it’s accumulation before an uptrend or distribution ahead of corrections.
To maximize the predictive value of volume analysis crypto and whale tracking, it’s important to contextualize these signals within broader market dynamics. Volume spikes alone aren’t always bullish or bearish; their significance depends on timing, accompanying price action, and the prevailing market narrative. For instance, a sudden surge in trading volume paired with large inflows to exchange wallets may hint at whales preparing to sell, while off-exchange accumulation often precedes rallies.
Integrating Whale Activity With Technical Indicators
Seasoned traders rarely rely on a single indicator. Instead, they combine whale activity data with established technical tools like RSI (Relative Strength Index), MACD (Moving Average Convergence Divergence), and Bollinger Bands. This multi-layered approach helps filter out noise and strengthens conviction in trade setups. For example, if you notice Bitcoin whales aggressively accumulating while RSI shows oversold conditions and volume is climbing, the probability of a reversal increases significantly.
Top Technical Indicators to Use with Whale Activity
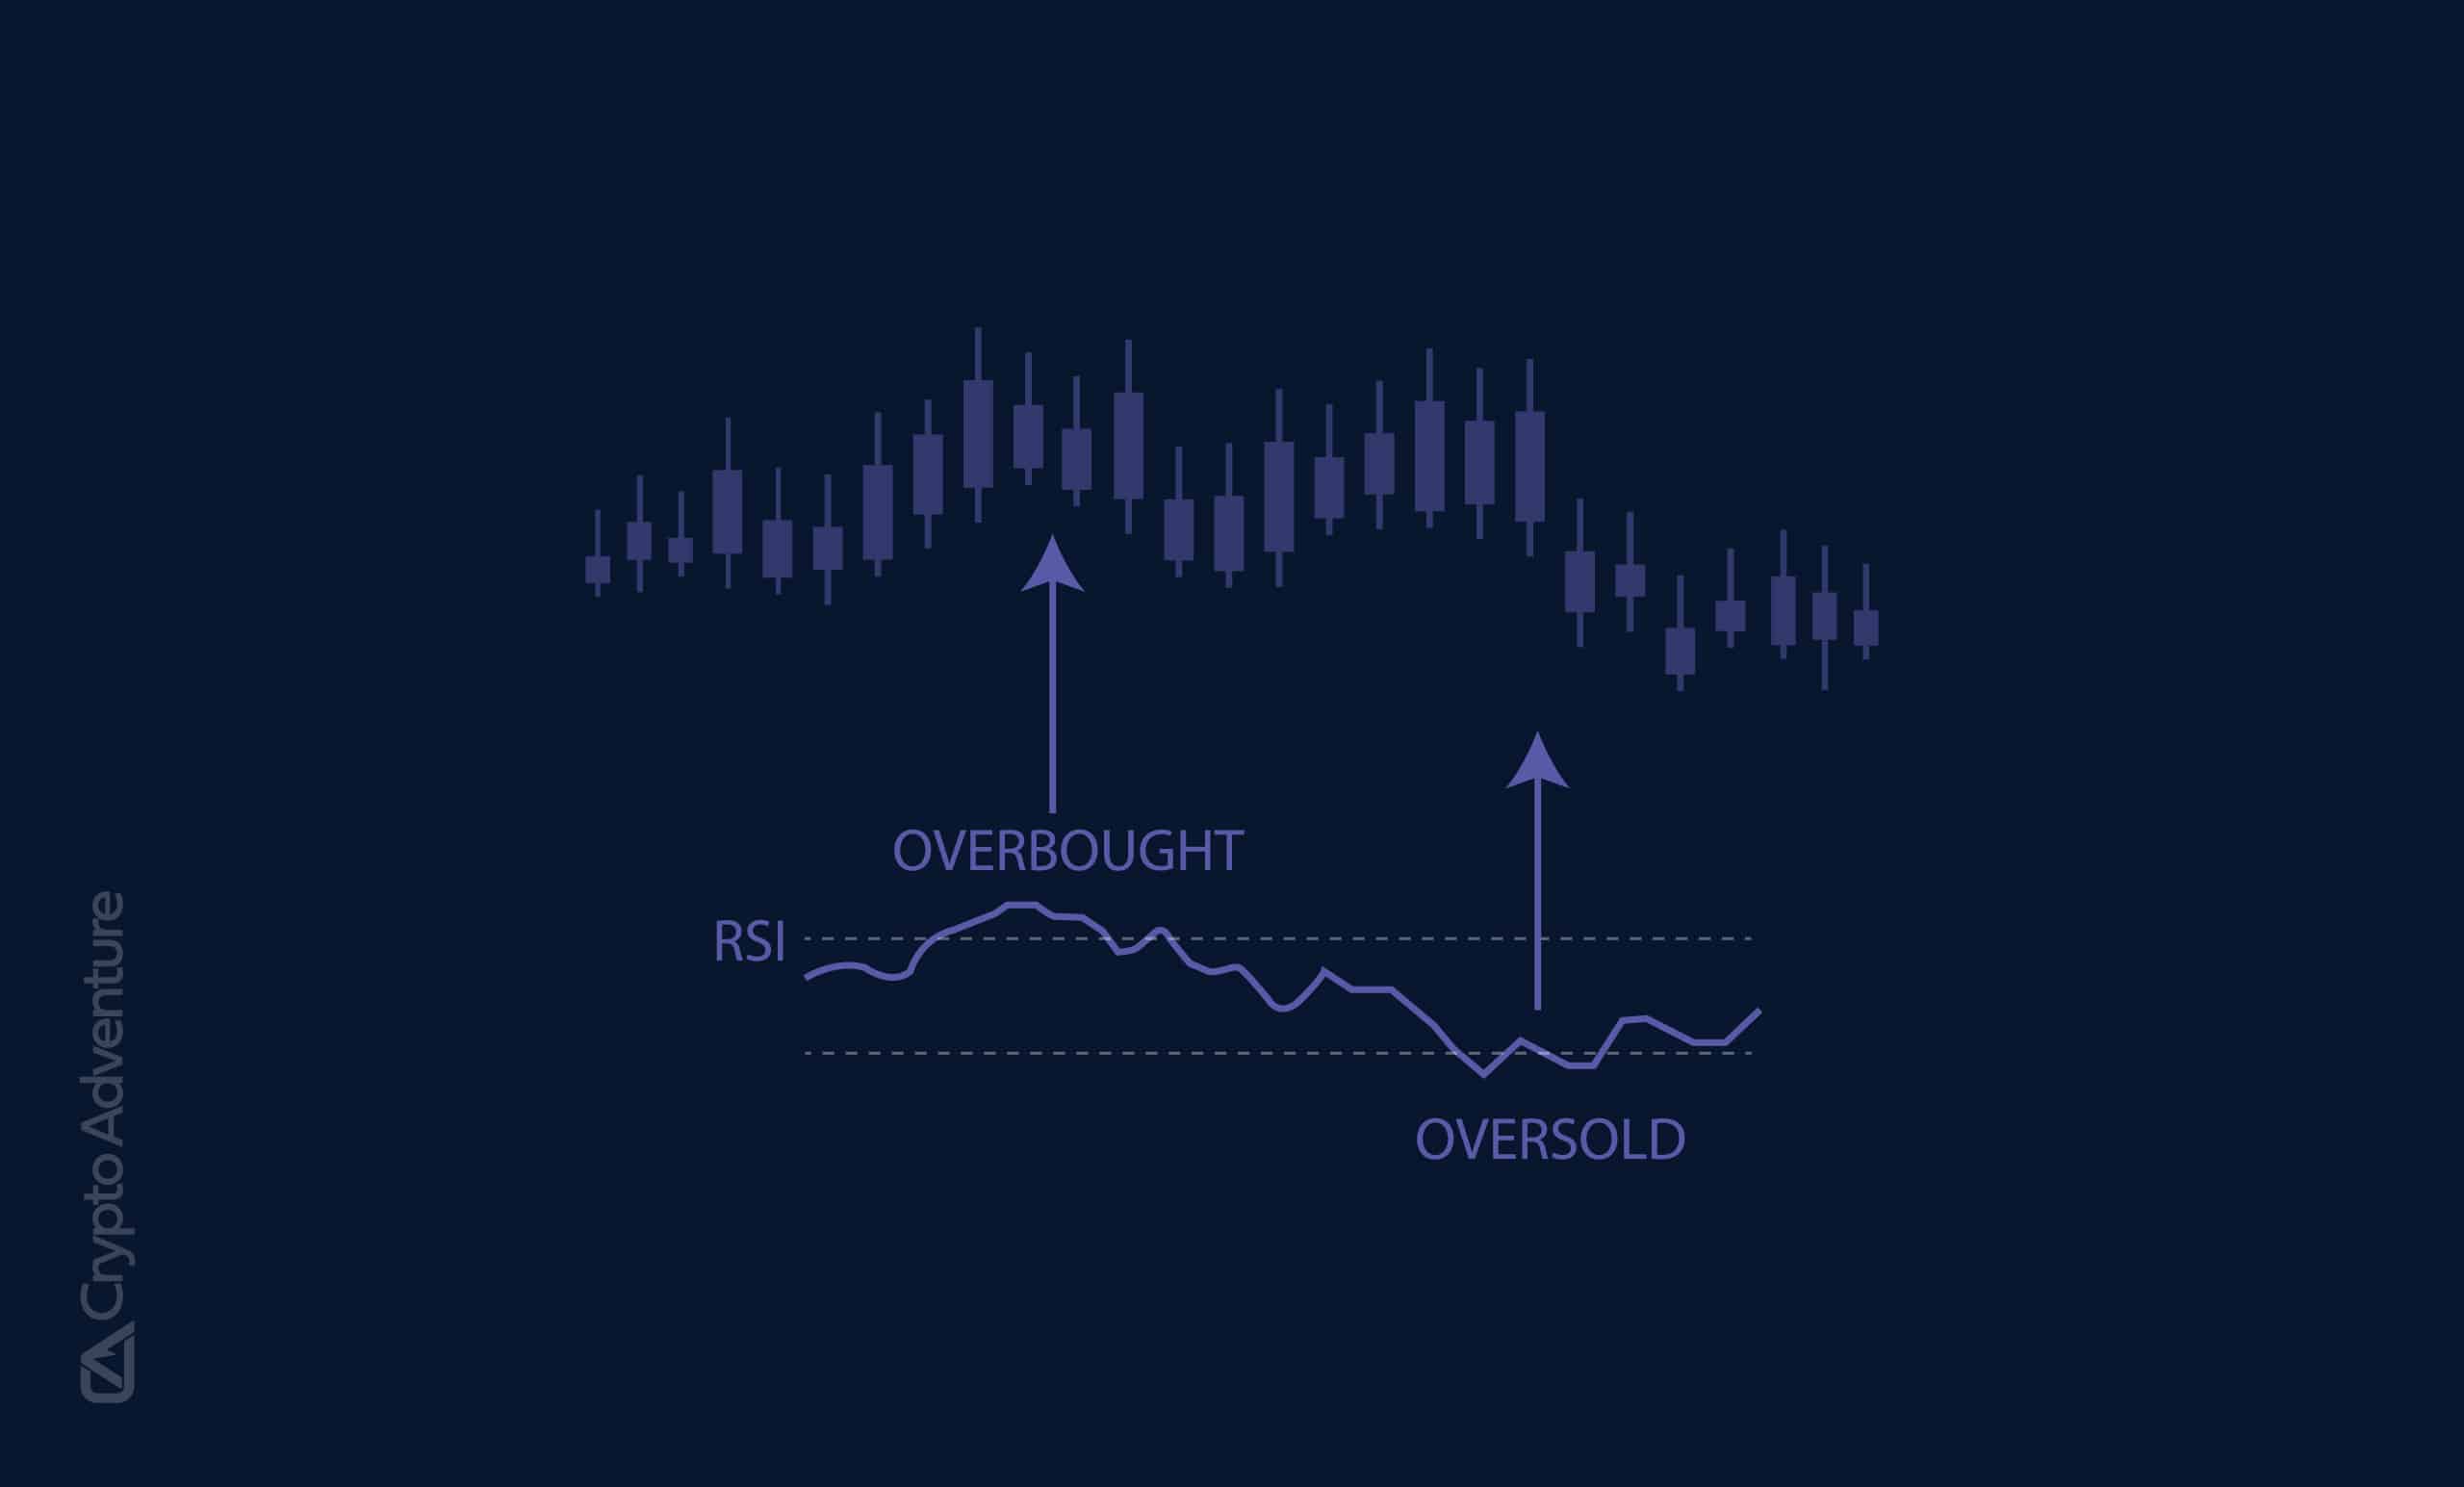
- Relative Strength Index (RSI): RSI measures the speed and change of price movements, helping traders spot overbought or oversold conditions. When combined with whale accumulation or distribution, RSI can confirm potential trend reversals.
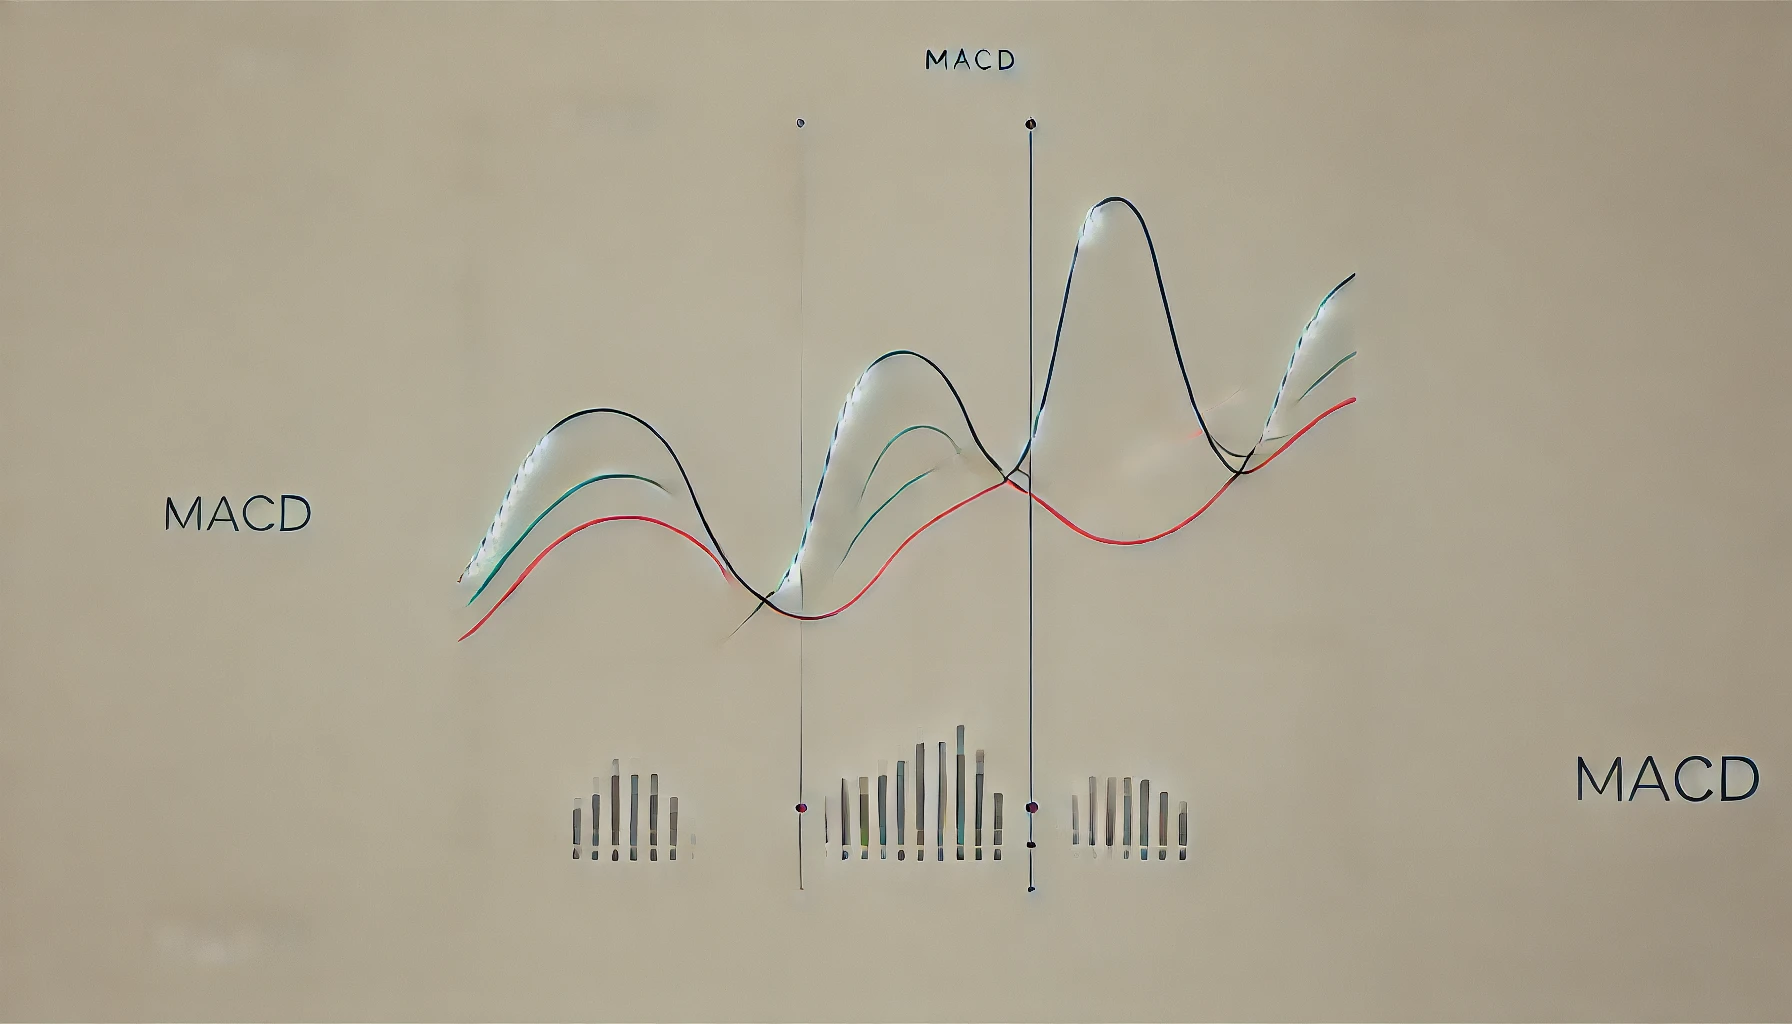
- Moving Average Convergence Divergence (MACD): MACD tracks trend momentum and identifies potential entry or exit points. Watching for MACD crossovers alongside large whale transactions can signal strong price moves.
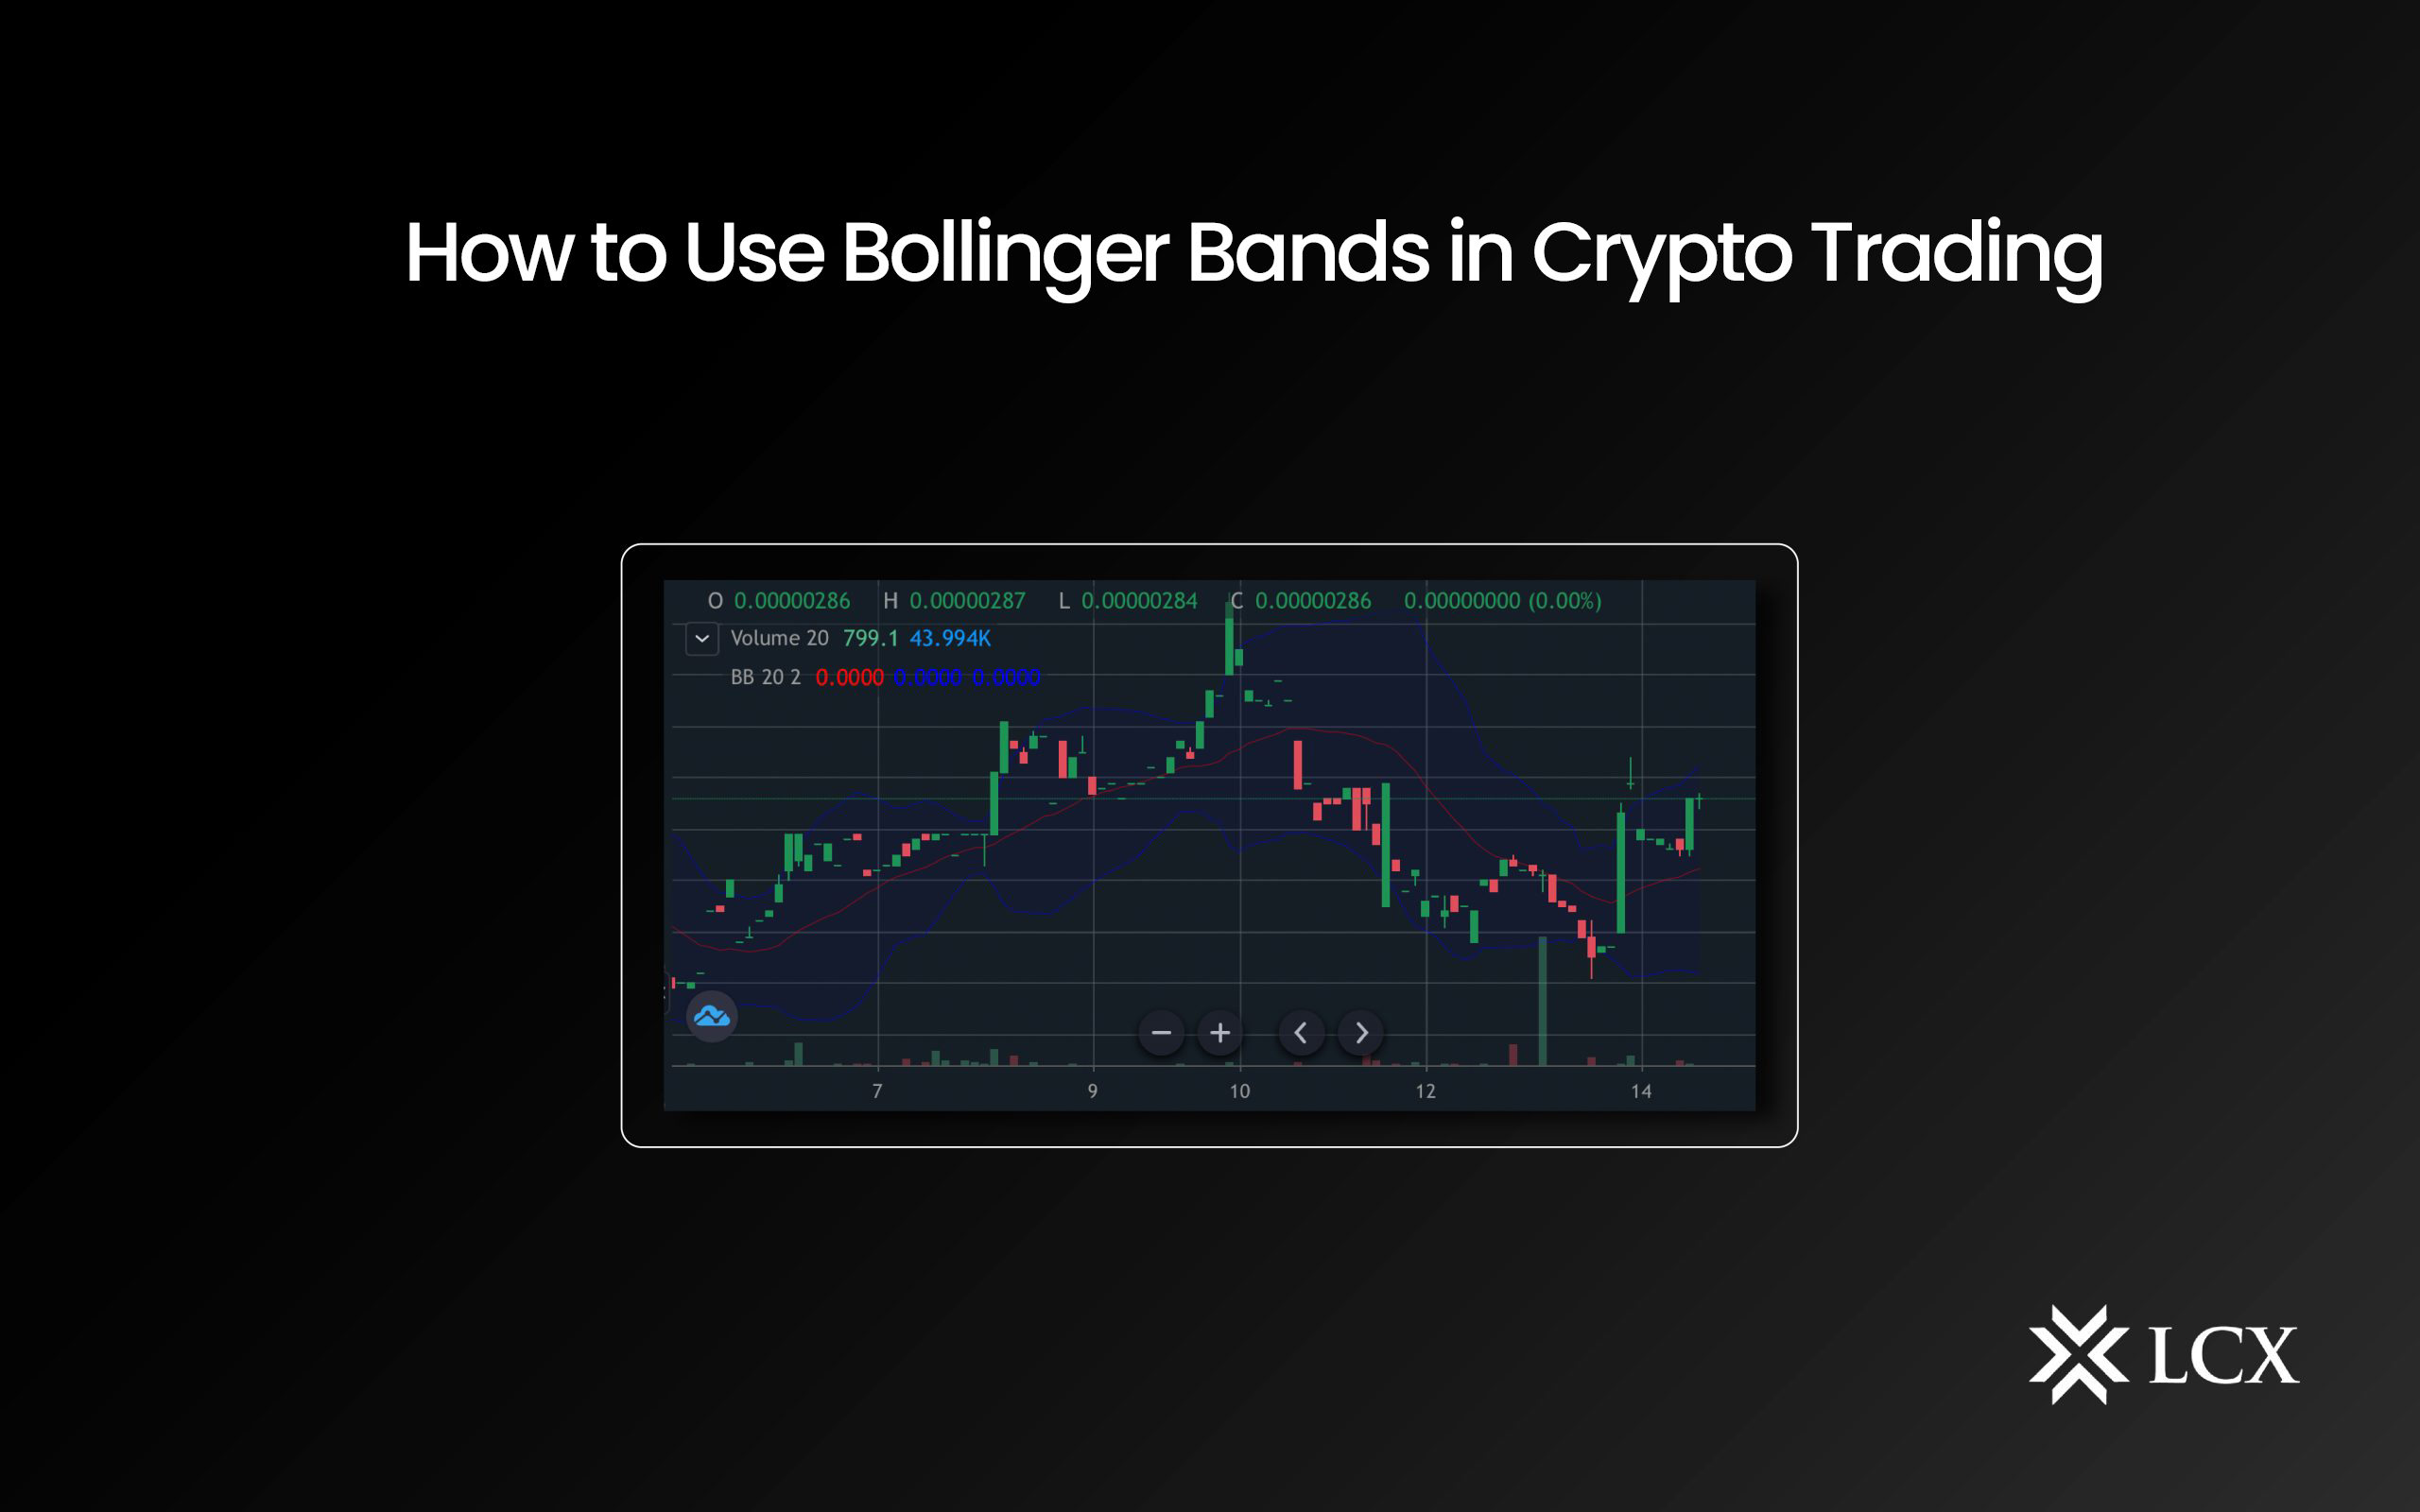
- Bollinger Bands: These bands visualize volatility by plotting standard deviations above and below a moving average. Whale-driven volume spikes that push prices outside the bands may indicate breakout or reversal opportunities.
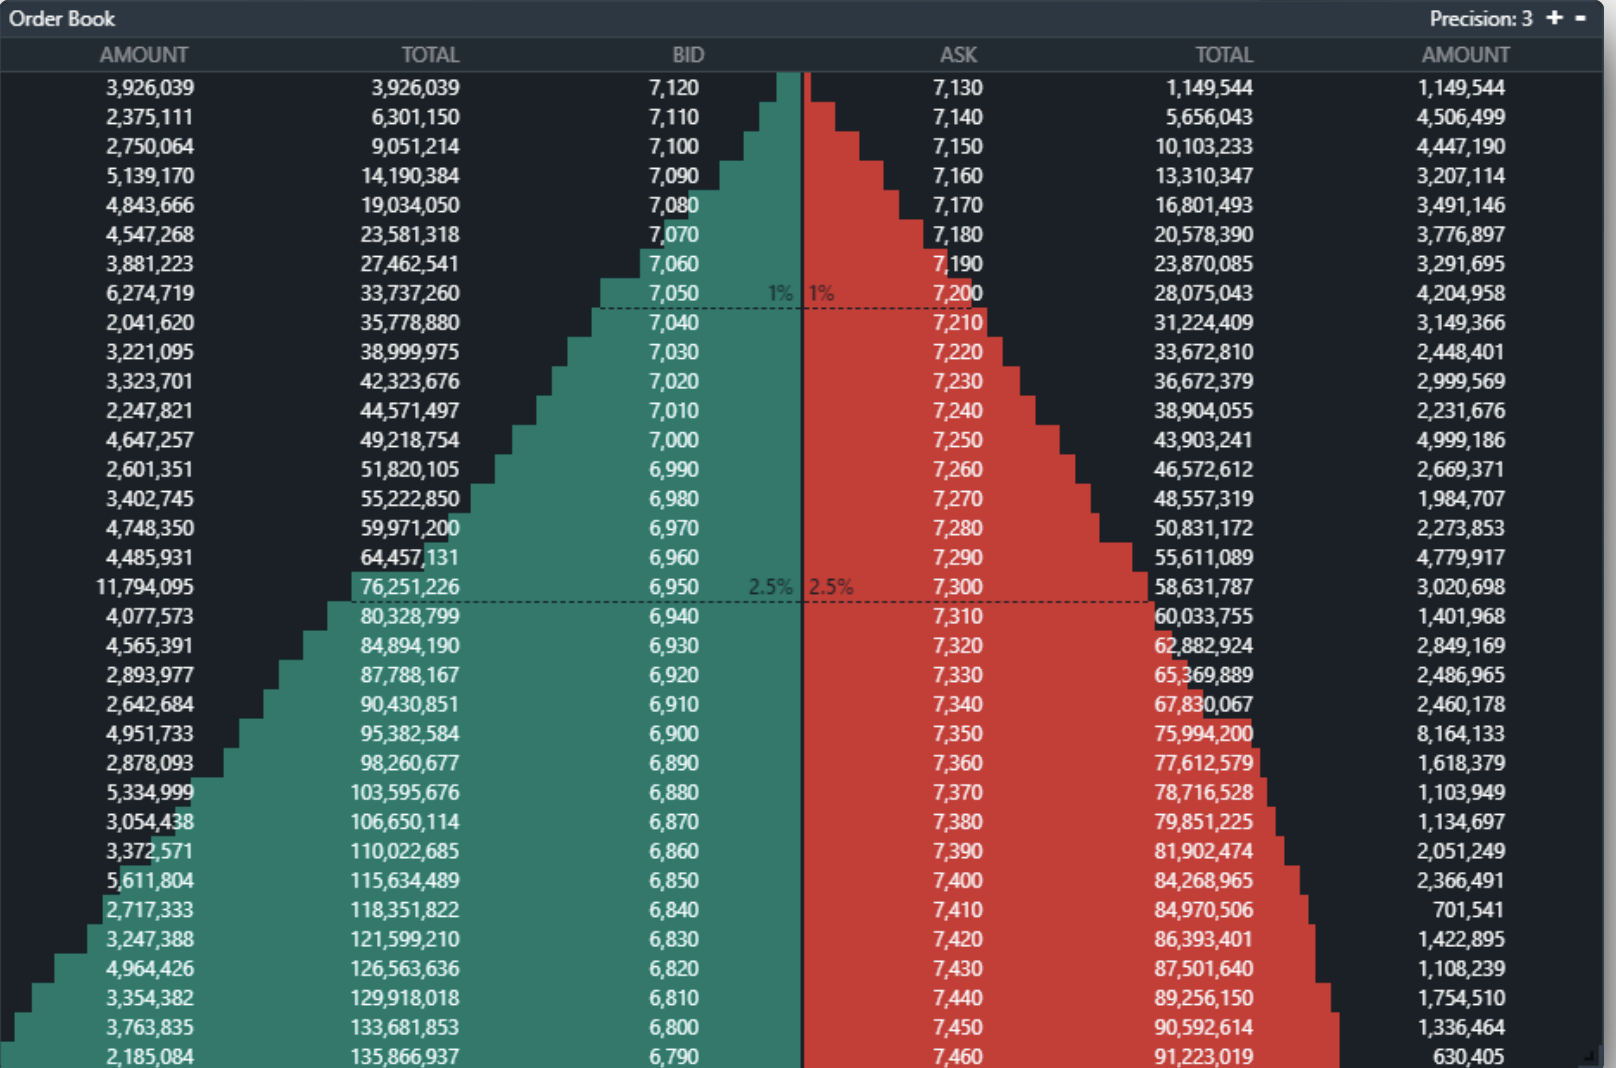
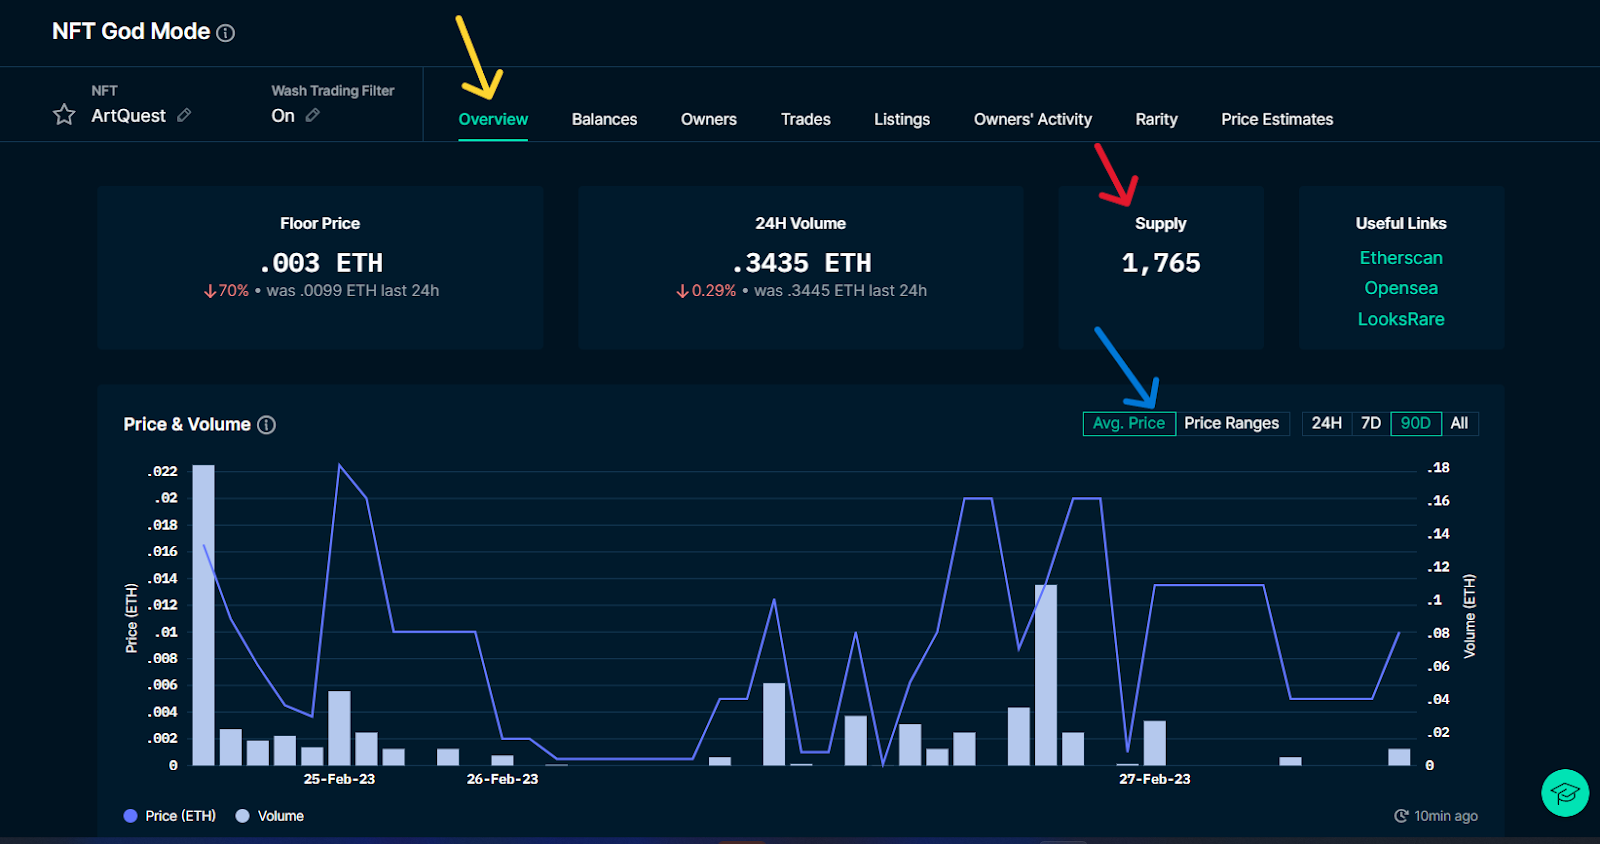
It’s also wise to monitor how volume behaves around key psychological price levels or resistance zones, such as Hyperliquid’s battle for $40 resistance (source). If whales are actively defending these levels by placing large buy walls, it can be a sign that institutional players are positioning for a breakout.
Risks and Limitations: Avoiding False Signals
No strategy is foolproof. Not every spike in volume or whale transfer will result in dramatic price movement. Sometimes, large transactions are internal transfers between wallets owned by the same entity or part of routine exchange operations. That’s why cross-referencing multiple data points, and understanding the context, is essential.
Additionally, markets react differently during periods of high volatility versus consolidation phases. During quiet markets, even modest whale moves can spark outsized reactions; in frothy bull runs, larger volumes may be needed to move prices meaningfully.
Actionable Steps for Predicting Crypto Price Movement
If you’re ready to incorporate these insights into your crypto trading strategies:
- Set up real-time alerts for both trading volume surges and large blockchain transactions using analytics tools tailored to your preferred exchanges and tokens.
- Regularly review order books, especially near major support/resistance levels where whales often reveal their hand.
- Maintain a watchlist of wallet addresses known for smart money trading, track their moves but always verify context before acting.
- Blend on-chain data with technical analysis, sentiment tracking (including social media), and macro news for a holistic view.
- Avoid emotional trades; use objective signals from volume and whale activity as part of a disciplined risk management plan.
The most successful traders treat on-chain metrics as one piece of the puzzle, valuable but not infallible. By systematically monitoring both trading volumes and whale behavior while staying attuned to market structure shifts, you can improve your odds of anticipating major moves before they hit mainstream headlines.
No comments yet. Be the first to share your thoughts!