
Spotting high-probability crypto trades is not about chasing every green candle or panic-selling at every dip. Instead, it’s about strategic entries and exits, using technical frameworks that consistently put the odds in your favor. One of the most pragmatic yet overlooked frameworks in crypto chart analysis is the use of premium and discount ranges. These zones, mapped directly from price action, reveal where smart money is likely to buy low and sell high - literally.
Premium vs Discount: The Foundation of High-Probability Crypto Trades
The distinction between premium and discount is fundamental. In a bullish trend, prices above the 50% retracement level are considered premium - this is where assets trade at a relative overvaluation. Conversely, prices below that midpoint enter the discount zone, signaling undervaluation and potential opportunity for buyers.
This model isn’t just theory; it’s a core principle for institutional traders and savvy retail players alike. For example, as of September 25,2025:
- Bitcoin (BTC): $109,760.00 (down $3,900.00 intraday)
- Ethereum (ETH): $3,922.77 (down $250.20 intraday)
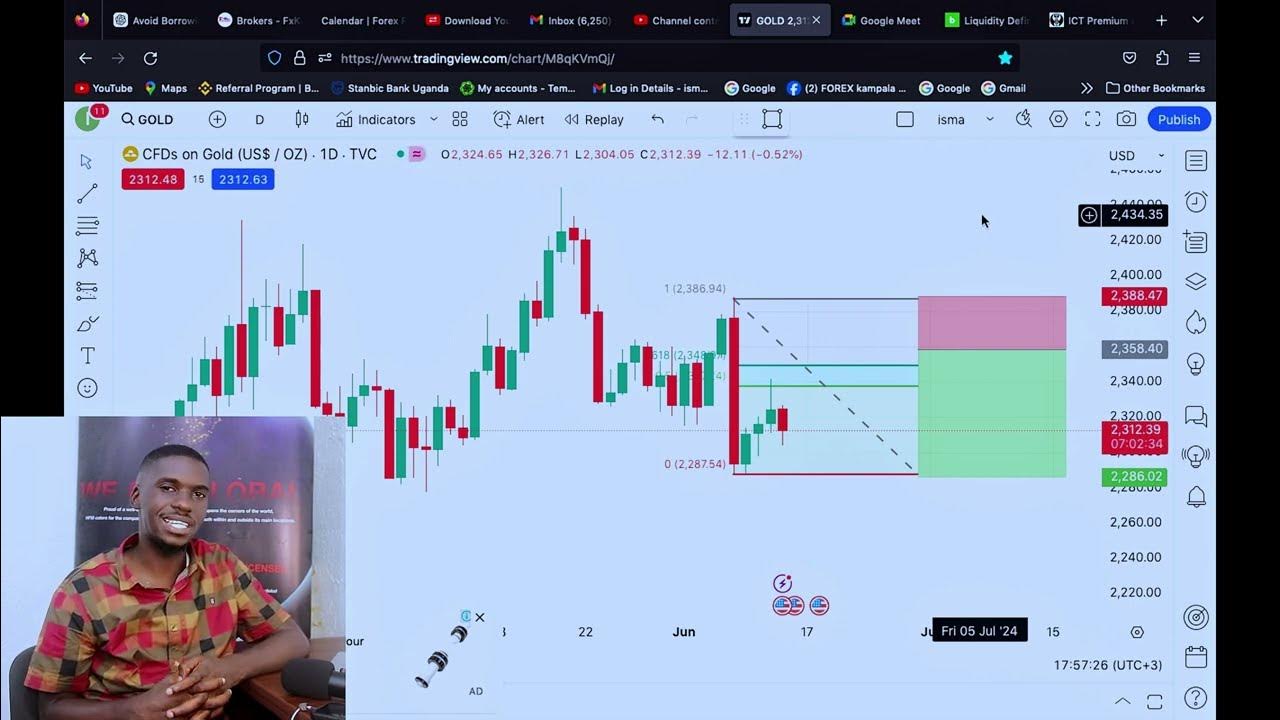
If BTC’s recent swing low was $108,783.00 and its swing high was $113,708.00, plotting a Fibonacci retracement on this range puts the equilibrium (50%) around $111,245.50. Any price action below this level falls into discount territory - prime hunting ground for long setups if broader momentum supports it.
"Premium is expensive. Discount is cheap. " - Chartfanatics via Instagram
Applying Premium and Discount Ranges to Current Market Structure
The real edge comes from integrating these zones with current market structure trading in crypto:
Key Steps to Identify Premium & Discount Ranges
- Determine the prevailing trend on the chart using higher time frames (H4, H1, or Daily) to establish a bullish or bearish bias.
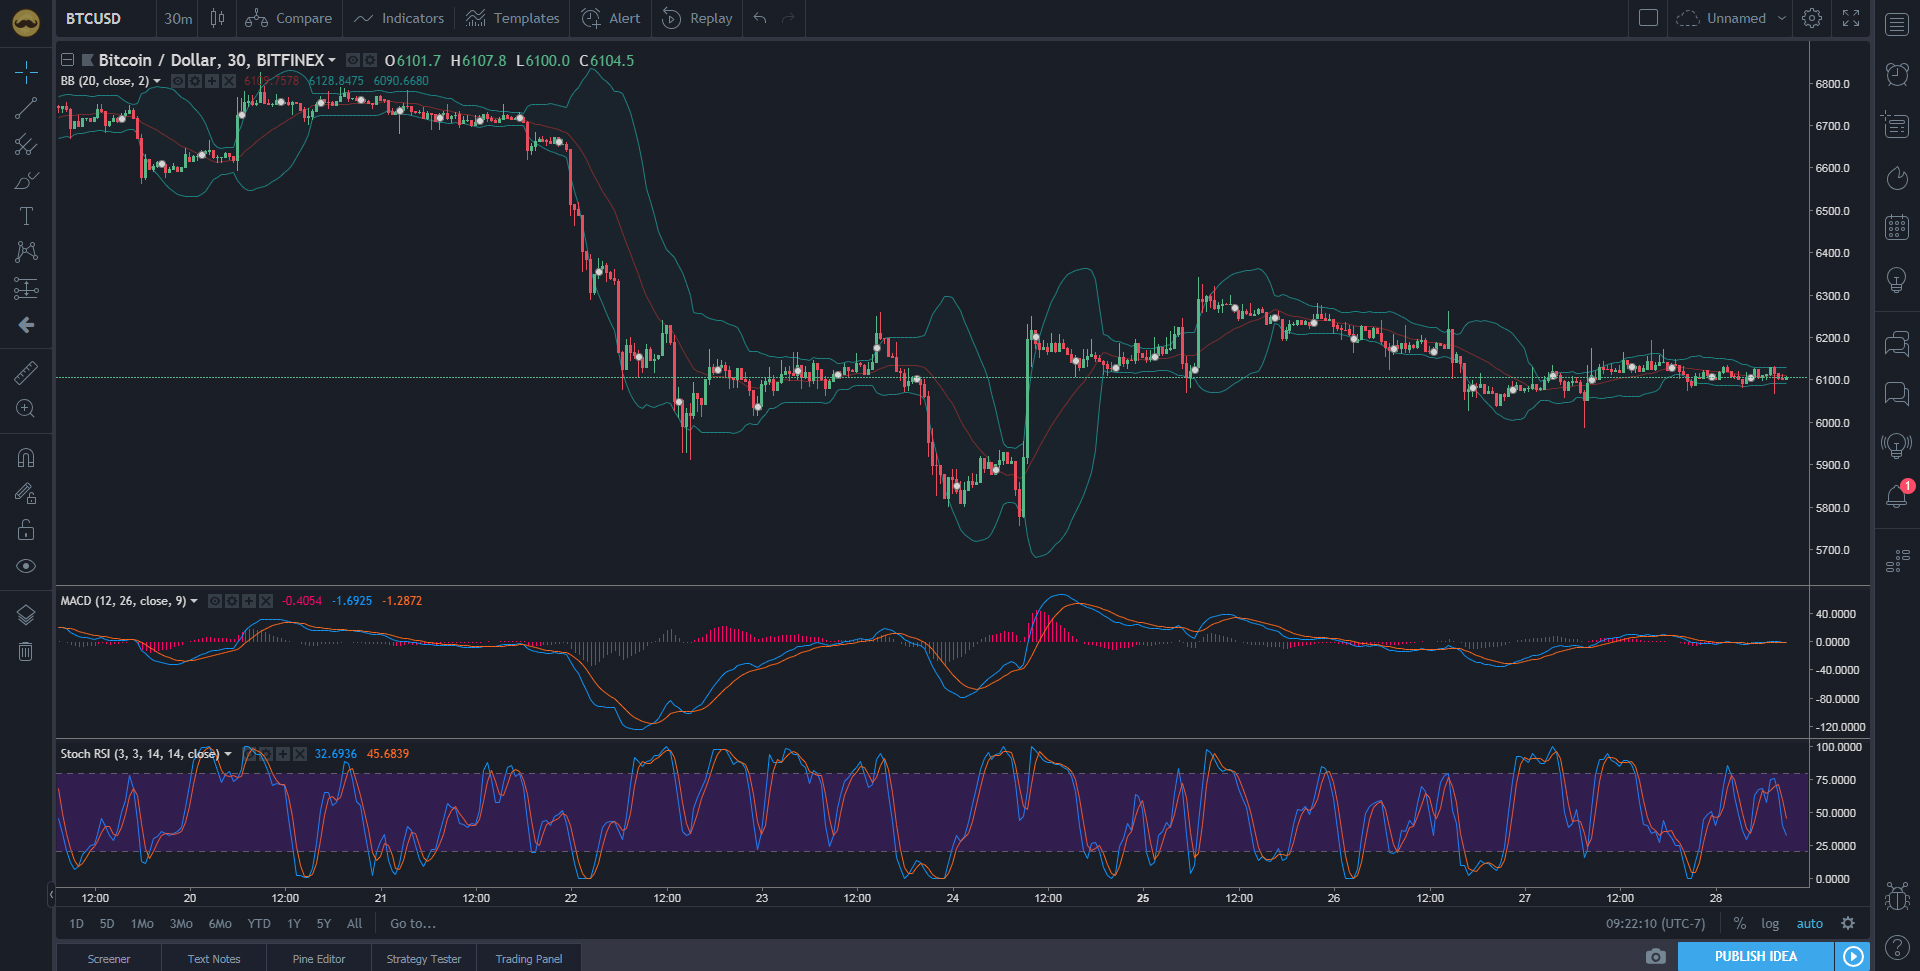
- Identify the swing high and swing low for the selected period, marking the most recent significant price extremes.
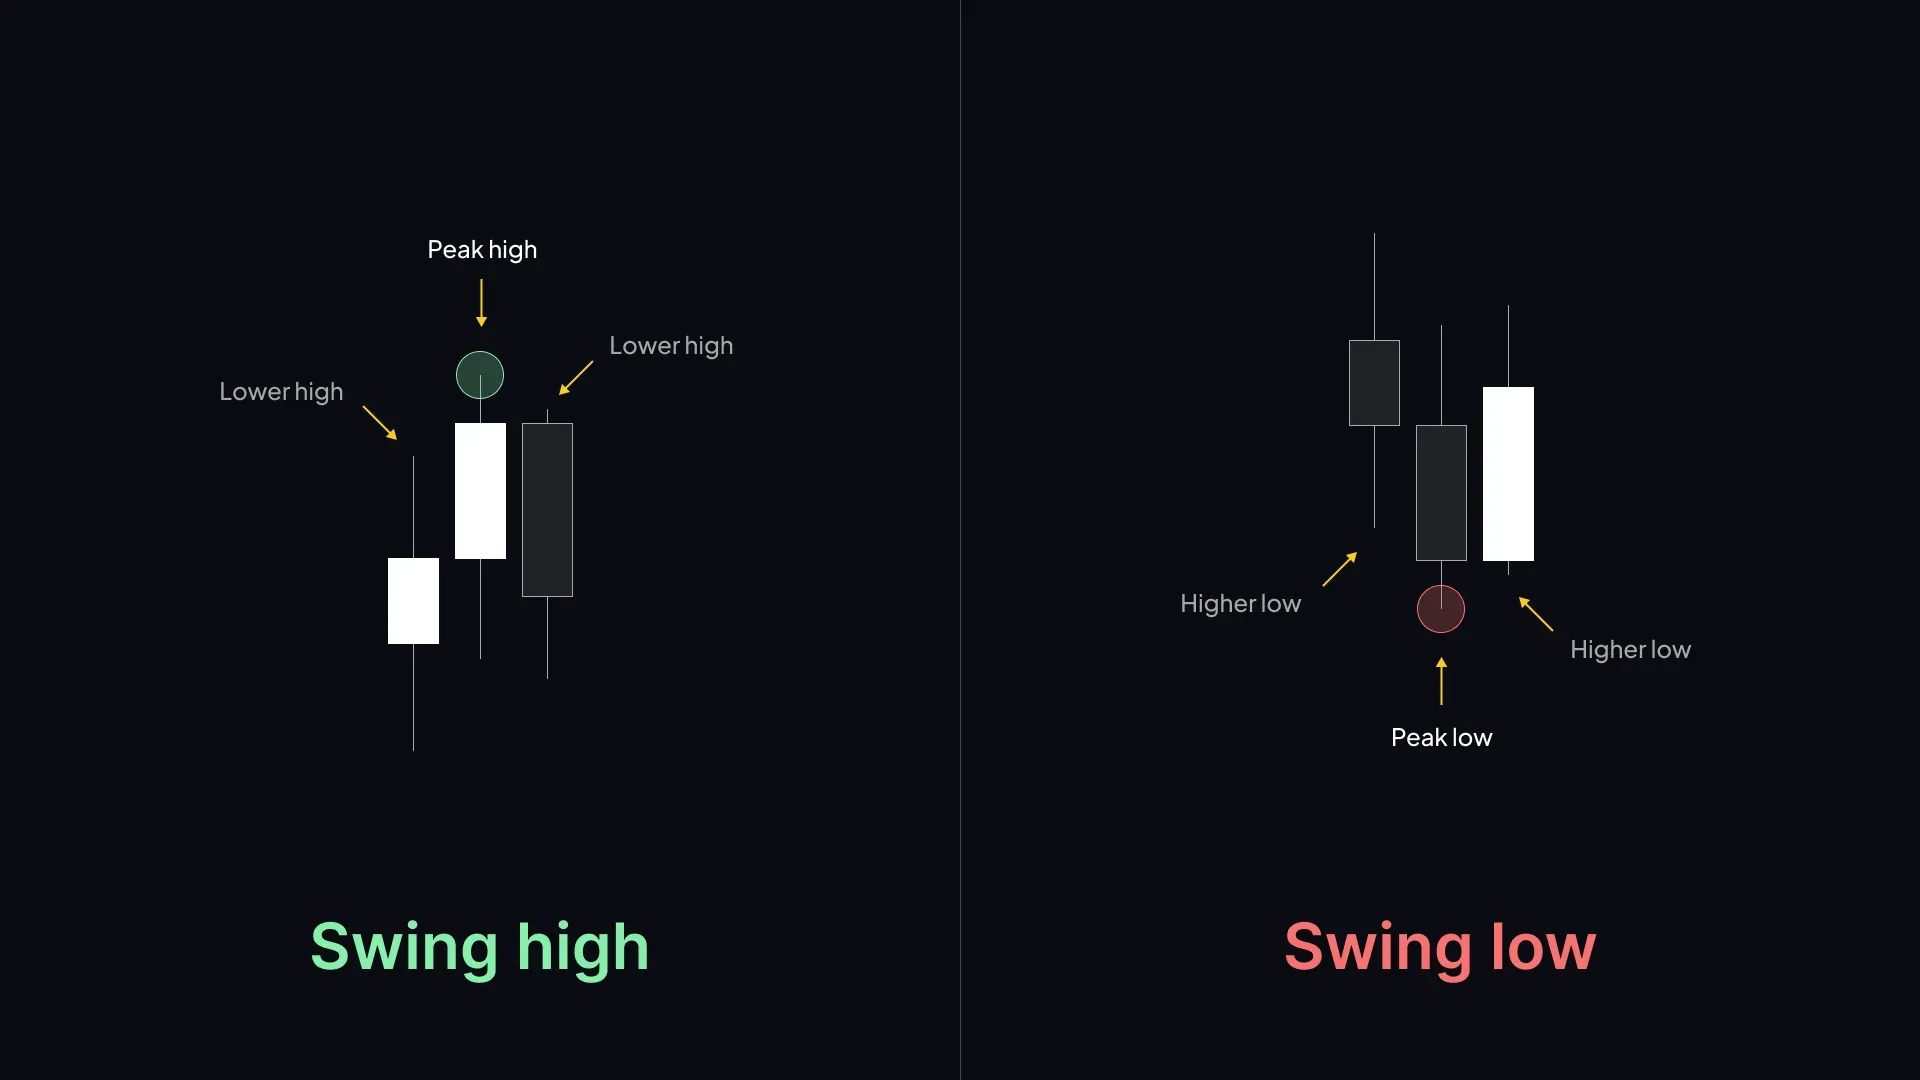
- Apply the Fibonacci retracement tool from swing low to swing high (for bullish trends) or swing high to swing low (for bearish trends) to map out key levels.
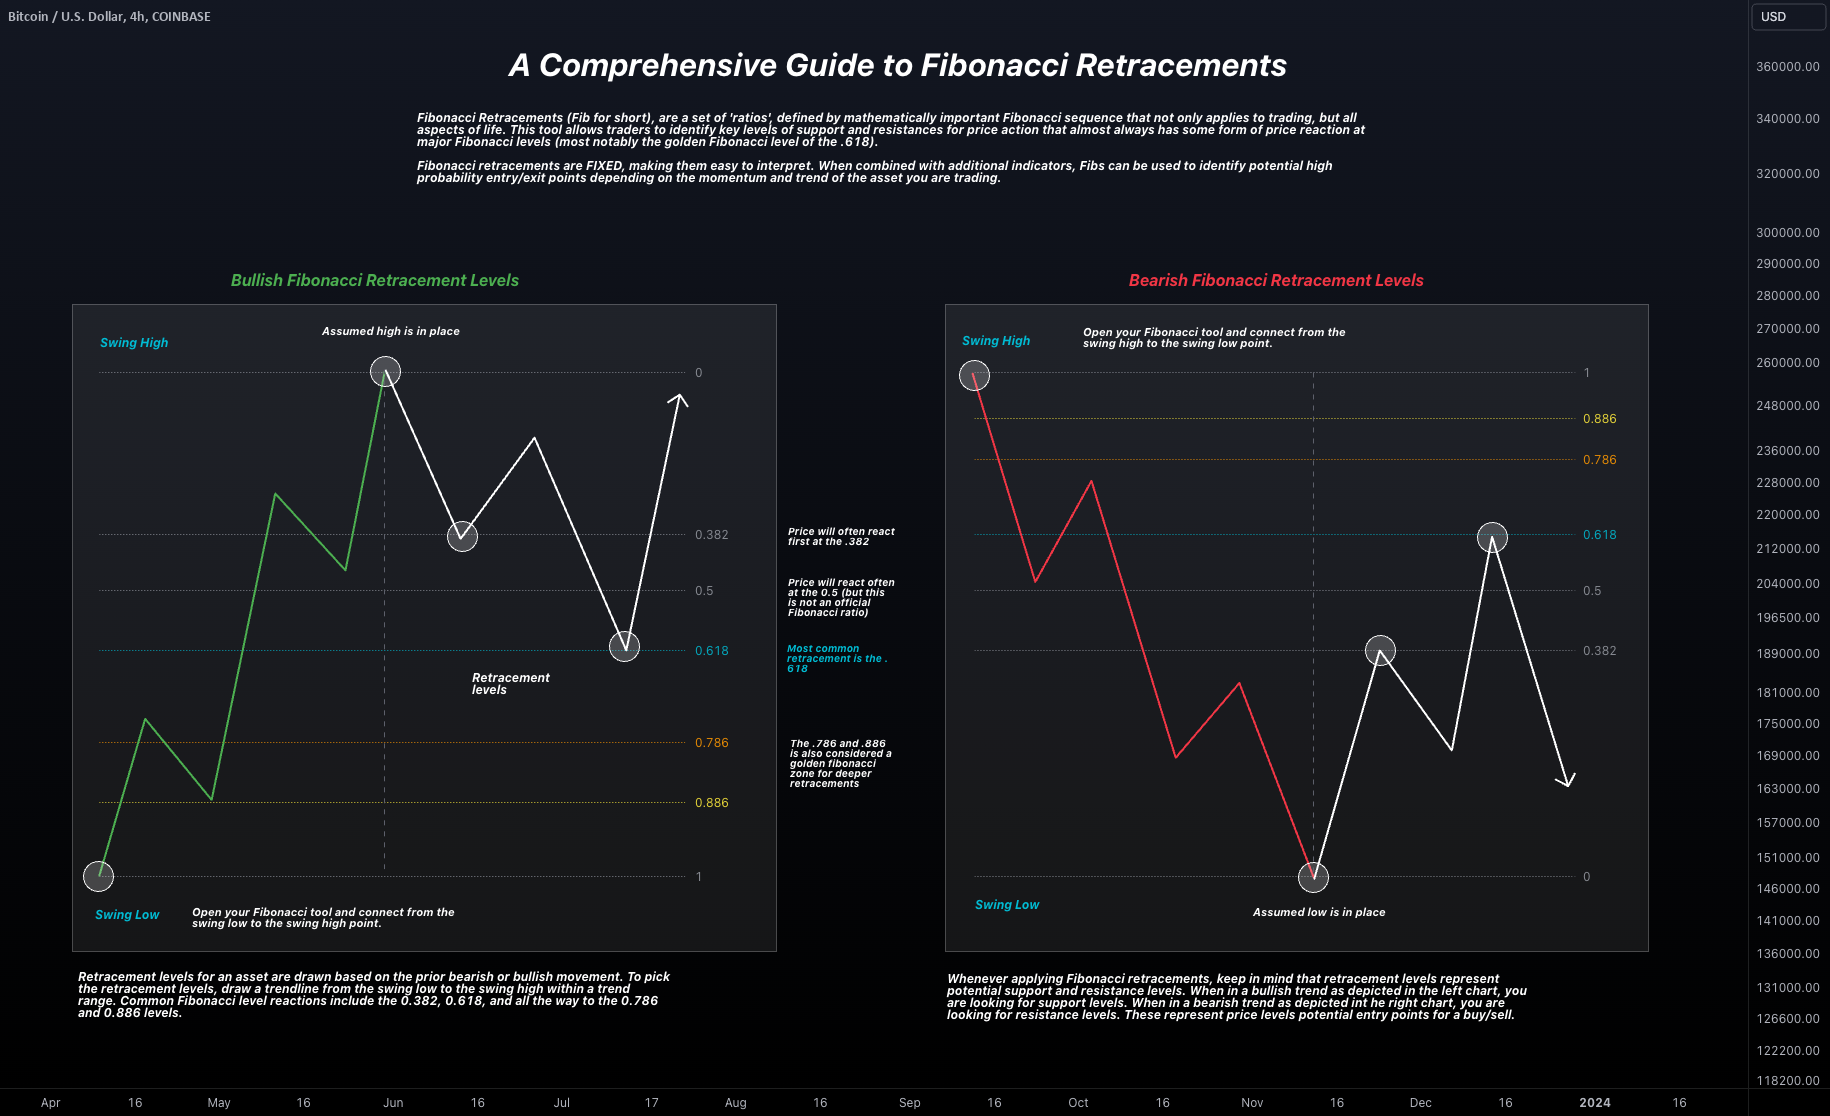
- Mark the 50% retracement level as the equilibrium point; this divides the range into premium (above 50%) and discount (below 50%) zones.
- Identify premium and discount zones: In a bullish trend, the area below 50% is the discount zone (ideal for long entries), while above 50% is the premium zone (potential for profit-taking or shorts).
- Look for confluence with other indicators such as support/resistance, moving averages, or volume spikes to validate premium/discount zones.
- Monitor current price action in relation to these zones. For example, as of September 25, 2025, Bitcoin (BTC) is trading at $109,760 and Ethereum (ETH) at $3,922.77—compare these prices to your identified ranges for actionable signals.
- Identify trend direction: Is the dominant move up or down?
- Select your timeframe: Higher timeframes like H4 or daily provide more reliable context.
- Plot Fibonacci retracement: Use recent swing highs/lows to define your range.
- Delineate zones: Above 50% = premium (potential sell/TP area); below 50% = discount (potential buy area).
- Add confluence: Look for overlap with support/resistance or moving averages to boost probability.
The Power of Confluence: Stacking Probabilities in Your Favor
No single indicator guarantees success; smart traders stack probabilities by combining premium/discount analysis with other tools:
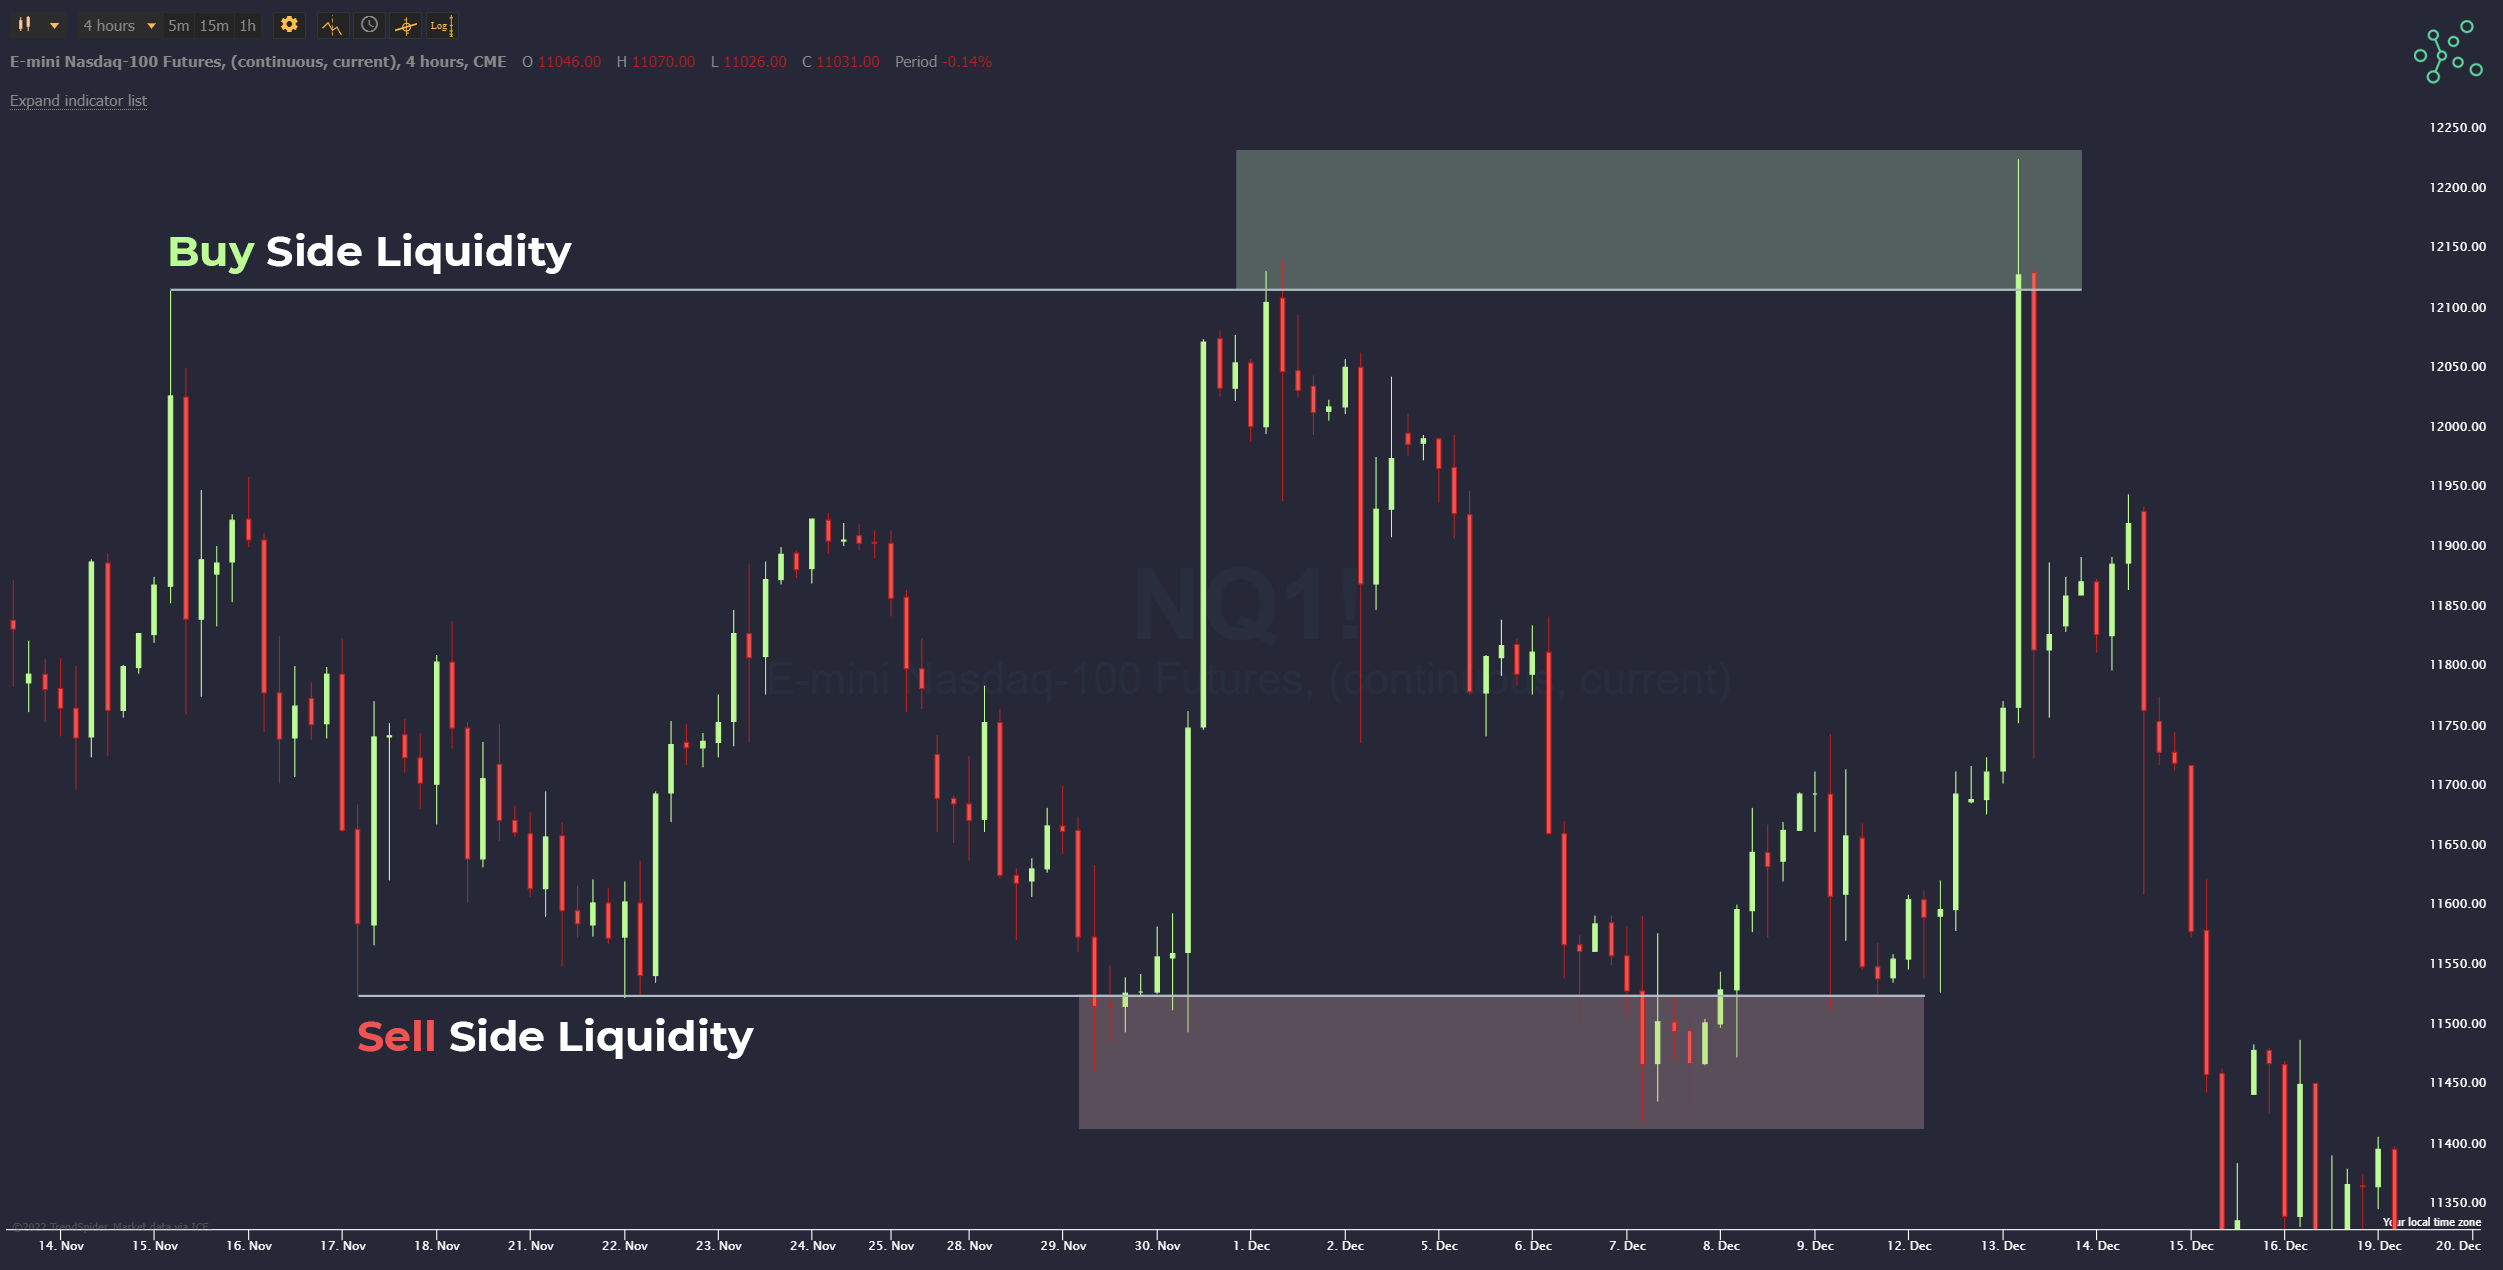
- Support and Resistance: Confirm if a discount entry aligns with a proven demand zone.
- Volume Analysis: Watch for increased buying volume as price enters discount territory.
- Candlestick Patterns: Seek reversal signals within these zones to time entries more precisely.
This approach transforms generic setups into high-probability crypto trade setups by filtering noise and focusing only on areas where risk/reward skews heavily in your favor.
Let’s put this framework into practice with the current market context. With Bitcoin (BTC) trading at $109,760.00, price sits just below the 50% equilibrium of its latest swing range ($111,245.50). This places BTC in a discount zone, but traders should resist the urge to blindly buy. Instead, look for confirmation: is there a bullish candlestick reversal on the H1 or H4? Does volume spike as price tests the lower end of this range? Are key moving averages or previous support levels converging near this area? These are the questions that separate disciplined execution from guesswork.
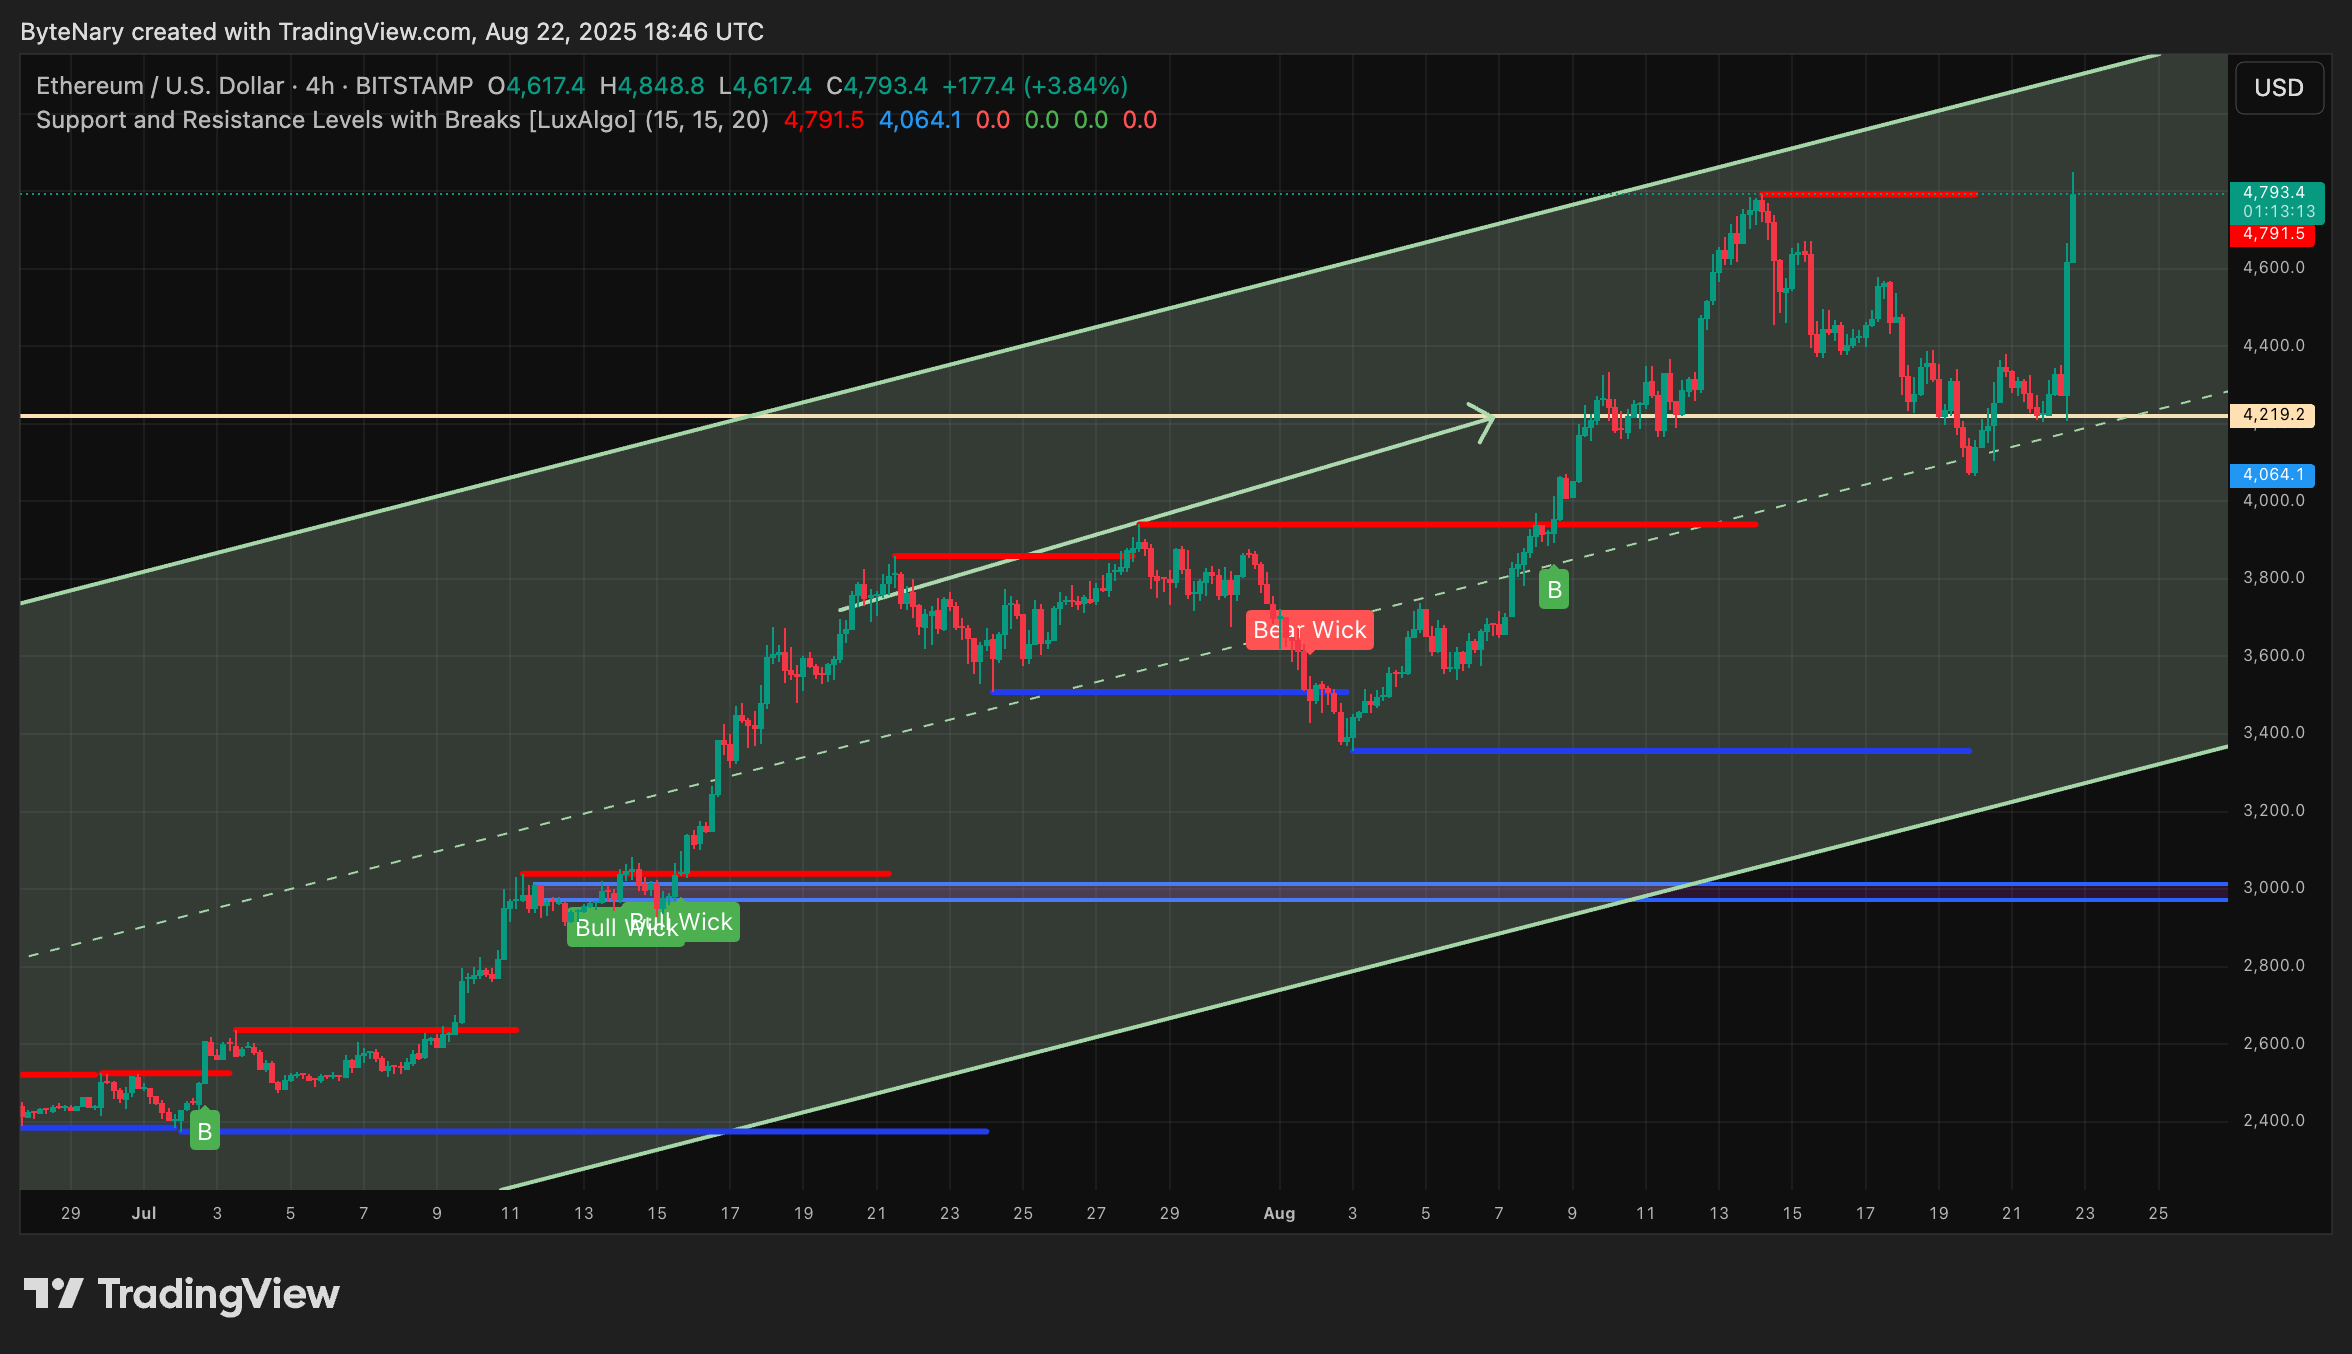
Ethereum (ETH), currently at $3,922.77, shows a similar dynamic. If ETH’s recent swing low and high mirror Bitcoin’s structure, traders can apply the same logic: wait for price to dip convincingly into discount territory and seek confluence before entering long. The goal is not just to buy cheap, but to buy when probabilities are stacked in your favor.
Risk Management and Trade Execution
Identifying premium and discount ranges is only half the battle; executing trades with discipline is what protects capital and compounds gains over time. Here’s how to approach it:
- Set stop-loss orders just beyond recent swing points to limit downside if your thesis fails.
- Size positions appropriately: Never risk more than a predetermined percentage of your portfolio on one trade.
- Take partial profits as price approaches equilibrium or enters premium territory in an uptrend.
This disciplined approach ensures you’re not caught offside by sudden volatility, a hallmark of crypto markets.
Common Pitfalls When Trading Premium and Discount Ranges
Avoiding rookie mistakes is critical if you want consistency in your results:
- Avoid impulsive entries: Don’t enter trades simply because price touches a zone, wait for confirmation signals.
- Don’t ignore higher timeframes: Lower timeframe noise can lead to false signals; always check alignment with broader trends.
- No single tool is enough: Premium/discount analysis works best when combined with other technical and fundamental factors.
Real-Time Monitoring: Stay Adaptive With Price Widgets and Charts
The crypto market doesn’t sleep, and neither should your analysis. Use real-time tools to monitor live prices, update your bias, and adapt quickly if conditions change. For example:
If BTC dips further below $109,760.00 or ETH breaks under $3,922.77, reassess whether momentum remains bullish or if further downside risk looms. Adaptive traders thrive; rigid ones get left behind.
The best trades come from patience, waiting for high-probability setups where multiple signals align within premium or discount zones.
If you’re looking to build robust strategies around premium range crypto trading, start by mastering these core principles before layering on advanced techniques like Fair Value Gaps or IPDA data ranges referenced by top educators across platforms like TradingView and Medium.


No comments yet. Be the first to share your thoughts!