
Solana’s ecosystem is experiencing a dramatic surge in 2025, with the network’s total value locked (TVL) in DeFi protocols reaching $8, 9 billion and its stablecoin supply hitting $11.7 billion. As of September 20,2025, Binance-Peg SOL (SOL) trades at $238.20, reflecting both institutional confidence and retail momentum. The expansion of Solana’s ecosystem is not just about numbers; it’s about the underlying innovations and strategic opportunities that savvy traders can leverage to maximize returns. Let’s examine five actionable trading strategies that align with current market dynamics, focusing on staking yields, DeFi token momentum, institutional accumulation signals, volatility-based swing trading, and early project participation.
Leverage Staking Yields Amid Institutional Inflows
One of the most compelling features of Solana in 2025 is its robust staking ecosystem. With annualized yields between 7% and 8%, staking SOL offers a dual advantage: steady income from rewards and exposure to potential price appreciation as institutional inflows intensify. Over $1.7 billion in new institutional capital has entered Solana’s staking protocols this year alone, signaling strong confidence from corporate treasuries and funds (source). Liquid staking solutions like JitoSOL now account for roughly 39% of the market, enabling users to earn yield while maintaining liquidity for further DeFi participation.
This influx of capital continues to enhance the security and decentralization of the network while providing an attractive risk-adjusted return profile for both new entrants and seasoned traders seeking passive income streams.
Trade Ecosystem Tokens Riding DeFi Expansion
The next frontier for gains lies within Solana’s expanding DeFi landscape. Platforms like Jupiter dominate perpetual trading with a 79.2% market share, while innovative protocols such as Jito, Marinade, and Orca are capturing significant user activity and liquidity. For active traders, monitoring these leading DeFi tokens is essential; they offer short- to mid-term momentum plays as TVL surges and new product launches drive fresh inflows.
Strategy tip: Use on-chain data to track TVL spikes or sudden increases in trading volume across these protocols, often a precursor to outsized price moves. Participating early in new protocol launches or governance proposals can also provide asymmetric upside as the ecosystem rapidly evolves.
Utilize On-Chain Analytics for Institutional Accumulation Signals
The growing presence of institutional investors has fundamentally reshaped how SOL price action unfolds in 2025. Tracking wallet flows, especially large transactions associated with funds or treasury companies, offers critical insights into periods of aggressive accumulation or distribution. When on-chain analytics indicate sustained buying pressure from institutions (e. g. , clusters of multi-million-dollar deposits into staking contracts or exchange wallets), traders can position ahead of potential rallies.
This data-driven approach requires vigilance but rewards patience; aligning entries with confirmed institutional activity often results in higher conviction trades with favorable risk/reward profiles.
Solana (SOL) Price Prediction 2026-2031
A Professional Outlook Based on Ecosystem Growth, Institutional Adoption, and Market Cycles
| Year | Minimum Price | Average Price | Maximum Price | YoY % Change (Avg) | Key Market Scenario |
|---|---|---|---|---|---|
| 2026 | $185.00 | $245.00 | $330.00 | +3% | ETF-driven institutional inflows, moderate volatility, potential regulatory headwinds |
| 2027 | $210.00 | $285.00 | $410.00 | +16% | DeFi/NFT expansion, increased developer activity, macroeconomic uncertainty |
| 2028 | $240.00 | $330.00 | $525.00 | +16% | Mainstream adoption of Solana-based consumer apps, scaling upgrades, competition from new L1s |
| 2029 | $280.00 | $385.00 | $650.00 | +17% | Network maturity, cross-chain integrations, stablecoin dominance |
| 2030 | $320.00 | $450.00 | $800.00 | +17% | Peak institutional adoption, global regulatory clarity, new use cases (e.g., RWAs, CBDCs) |
| 2031 | $370.00 | $510.00 | $950.00 | +13% | Sustained growth, mature DeFi/NFT markets, competition from next-gen blockchains |
Price Prediction Summary
Solana is positioned for sustained growth through 2031, buoyed by strong institutional adoption, robust developer activity, and ecosystem expansion. While price appreciation is likely to be steady, investors should expect periods of volatility, especially during broader crypto market corrections or shifts in regulatory policy. The launch of ETFs, deepening DeFi and NFT utility, and continued scaling improvements are expected to drive both price floors and upside potential. However, new competitors and unforeseen regulatory actions remain key risks.
Key Factors Affecting Solana Price
- Institutional inflows via ETFs and futures products
- Ecosystem expansion in DeFi, NFTs, and stablecoins
- Developer activity and network upgrades (e.g., scaling, composability)
- Regulatory clarity and global crypto policy developments
- Competition from Ethereum, emerging L1s, and new blockchain technologies
- Macroeconomic conditions affecting risk asset appetite
- Adoption of Solana in real-world applications (payments, tokenization, CBDCs)
Disclaimer: Cryptocurrency price predictions are speculative and based on current market analysis. Actual prices may vary significantly due to market volatility, regulatory changes, and other factors. Always do your own research before making investment decisions.
Employ Volatility-Based Swing Trading
Solana's heightened volatility in 2025 presents a fertile environment for disciplined swing traders. With Binance-Peg SOL (SOL) currently priced at $238.20, significant price swings are common around ecosystem announcements, protocol upgrades, and major DeFi launches. Technical tools such as Bollinger Bands and the Relative Strength Index (RSI) can help identify overbought or oversold conditions, while monitoring volume spikes around support and resistance levels sharpens entries and exits.
Key tactic: Focus on high-volume sessions following news, such as ETF approvals or CME futures launches, to capture directional moves. For instance, when Solana broke the $180 resistance amid institutional accumulation, traders who timed their swings with on-chain confirmation saw outsized returns. Always set stop-losses to manage risk, as volatility can cut both ways.
Solana Technical Analysis Chart
Analysis by Darren Kirkwood | Symbol: BINANCE:SOLUSDT | Interval: 1D | Drawings: 5
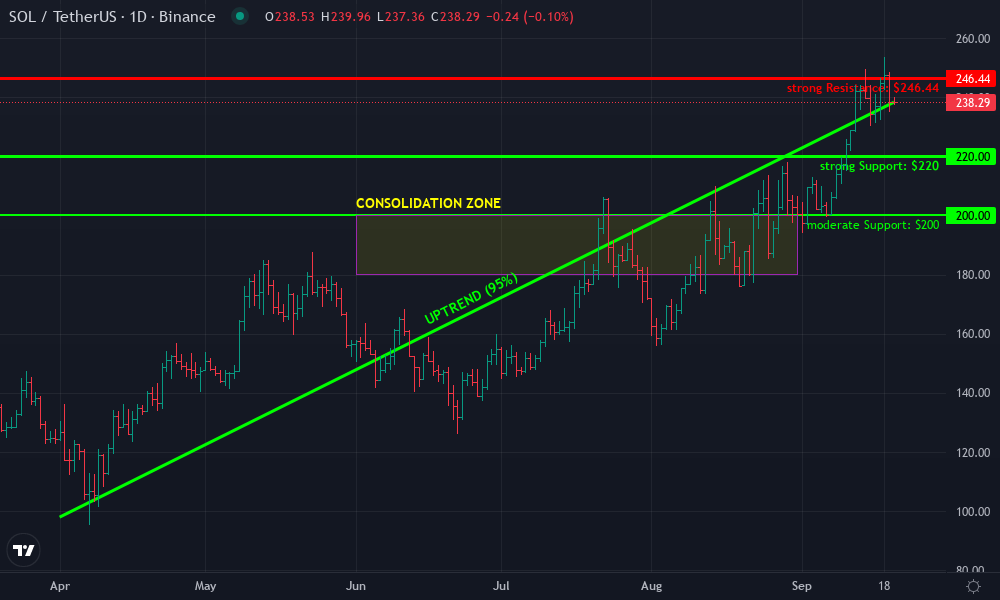
Technical Analysis Summary
Beginning from the April 2025 lows, draw an uptrend line connecting the higher lows through July and into mid-September 2025. Add horizontal resistance at the recent high near $246.44, and horizontal support at the breakout level around $220.00. Mark the prior consolidation range between $180.00 and $200.00 from June to August. Use a rectangle to highlight the September breakout zone. Add a callout noting the significance of the breakout above $220.00, referencing institutional accumulation and ETF developments as a catalyst. Place a text label for a conservative stop-loss zone slightly below $220.00. Use an arrow marker to suggest the next potential leg up if $246.44 is breached.
Risk Assessment:low
Analysis: Despite strong fundamentals and technicals, the prudent approach is to avoid chasing after a steep rally and only enter on confirmed retests.The risk of a retracement from local highs is non-trivial,and capital preservation is the priority.
Darren Kirkwood's Recommendation: Wait for a pullback to $220 .00 with clear support before considering entry.Avoid initiating new positions at current levels near resistance.
Key Support & Resistance Levels
📈 Support Levels:
- $220 - Breakout and retest level from September2025.Key support for trend continuation.strong
- $200 - Prior resistance,now secondary support.Acts as a buffer zone if$220 .00 fails.moderate
- $246 .44 -24 h high and current resistance.Needs to be convincingly broken for further upside.strong
- $220 - Retest of breakout level with confirmation of support.Aligned with conservative risk management.low risk
- $246 .44 - Take profit at recent resistance,unless clear breakout occurs.💰 profit target
- $215 - Stop-loss below strong support to limit downside risk.🛡️ stop loss
Pattern:Not directly visible in chart,but recent breakouts typically accompanied by above-average volume .Confirm with volume histogram.
Look for volume spikes on breakouts above $220 .00 and $246 .44.
Signal:Likely bullish given the strong uptrend,but overextension risk if price stalls below resistance.
MACD likely supports bullishness,but watch for divergence or loss of momentum.
Tags
Related Articles

Swing Trading MARA Stock Using Bitcoin Halving Cycles 2028
MARA stock trades at $10.54 today, up 1.74% amid Bitcoin's climb to $74,789 . With the 2028 halving looming, swing traders eye this crypto mining play for its leverage to BTC cycles. Marathon Digital Holdings thrives on block rewards, but...
Apr 14, 2026
Bitcoin $90K Support Breakout Trading Strategy: Fibonacci Entries and Volume Confirmation 2026
As of April 1,2026, Bitcoin sits at $68,575.00 , up and $1,189.00 ( and 1.76%) over the past 24 hours, with a high of $69,170.00 and low of $66,001.00 . This modest rebound follows a sharp breakdown below the $90K support , where macro...
Apr 1, 2026
Crypto Trading Bots vs Manual Trading: Automate Bitcoin and SOL Profits in 2026
Bitcoin trades at $70,552.00 today, a level that demands precision in every move. Solana's volatility adds another layer of challenge. Traders face a stark choice: trust crypto trading bots to execute flawlessly around the clock, or rely...
Mar 20, 2026
Trading Tron TRX and RWA Tokens After SEC Case Closure: 2026 Strategies
The SEC's dismissal of all charges against Justin Sun and Tron entities on March 8,2026, after Rainberry Inc. paid a $10 million civil penalty, removes a major overhang from the TRX ecosystem. This resolution, filed with prejudice to bar...
Mar 8, 2026
No comments yet. Be the first to share your thoughts!