
Success in crypto trading hinges on your ability to see both the forest and the trees. That’s where multi-timeframe analysis (MTFA) comes in: it helps you navigate the fast-moving crypto market by layering perspectives from different time intervals. Whether you’re a swing trader tracking Bitcoin’s macro trend or a day trader hunting for precise entries on Ethereum, MTFA empowers you to make more informed decisions and avoid costly mistakes.

Why Multi-Timeframe Analysis Matters in Crypto
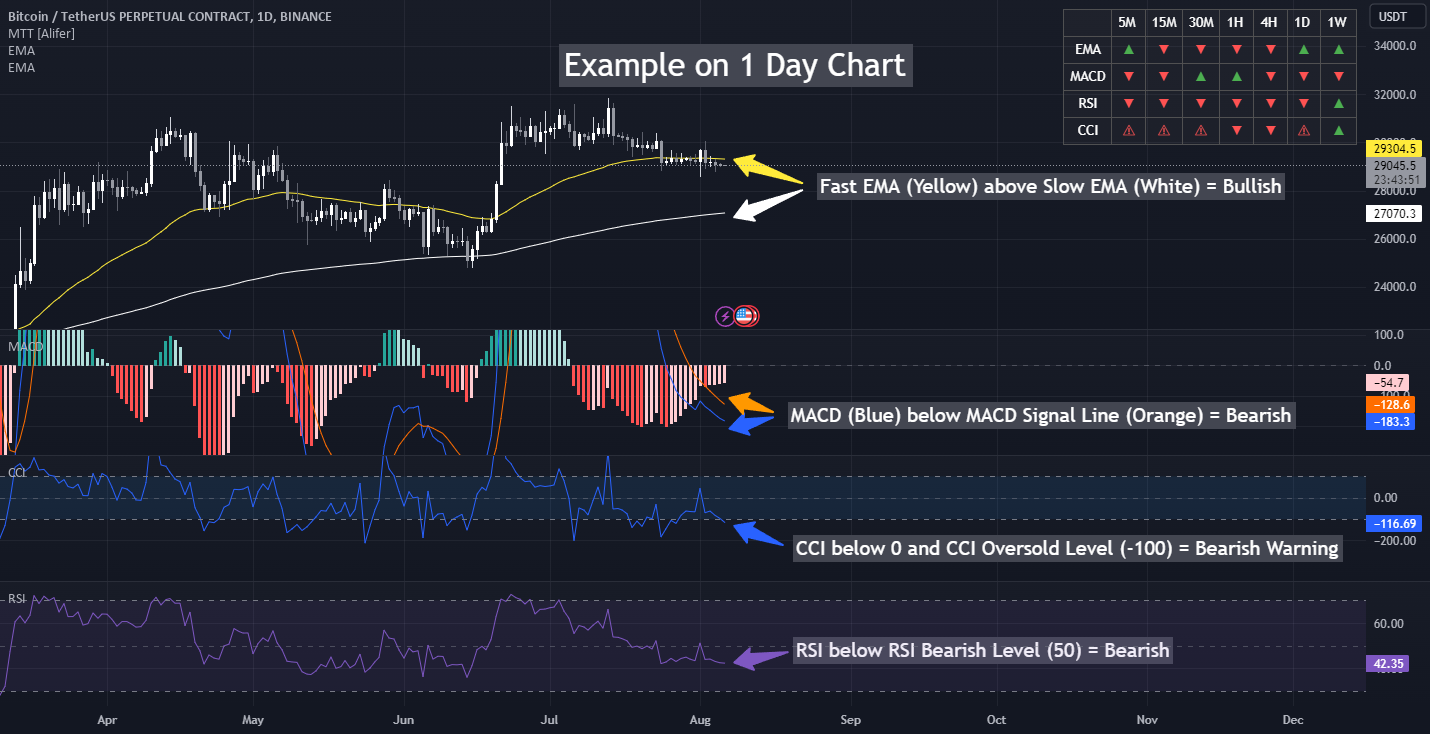
The volatility of digital assets means price action can look bullish on a 15-minute chart but bearish on the daily. By analyzing at least two or three timeframes, you gain a more complete view of market structure, trend direction, and key support/resistance zones. This top-down approach is widely cited as one of the most effective crypto trading strategies.
For example, if you spot an uptrend on the daily chart but see consolidation or even a pullback on lower timeframes like 1-hour or 15-minute, you’ll know to wait for confirmation before entering a trade. This reduces the risk of getting whipsawed by short-term volatility that contradicts the broader trend.
How to Structure Your Multi-Timeframe Analysis
The classic MTFA workflow involves three steps:
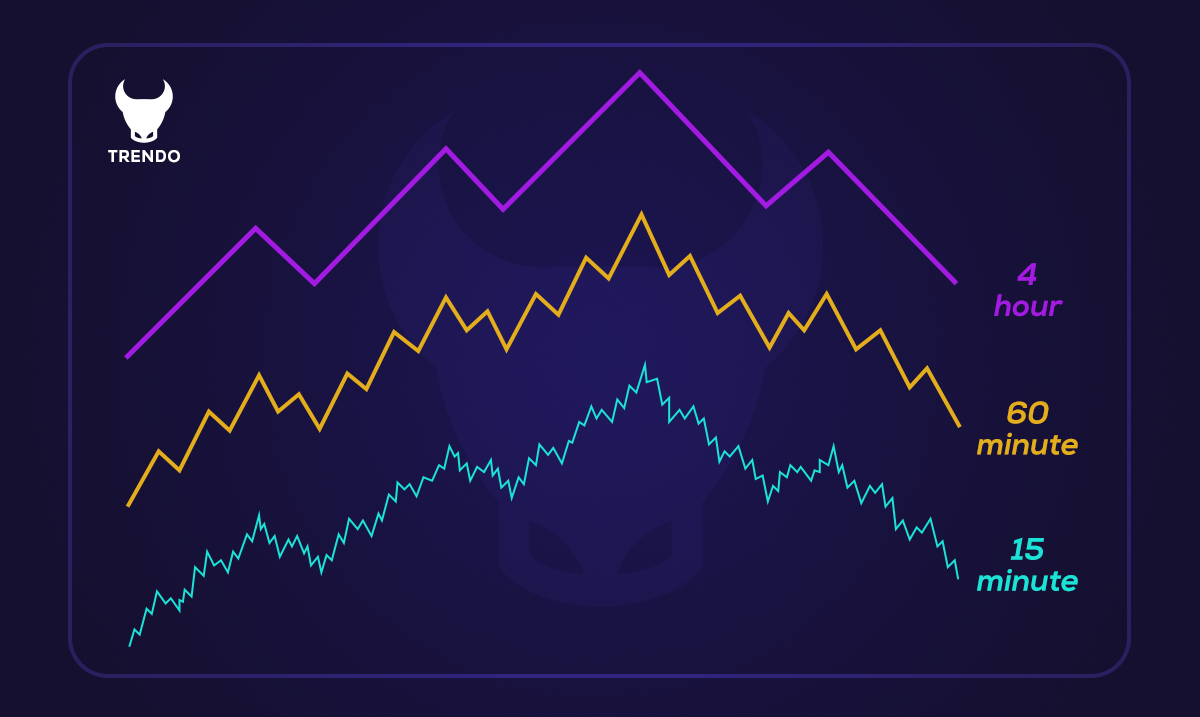
- Identify Macro Trend: Start with the highest relevant timeframe (weekly or daily) to determine if the asset is in an uptrend, downtrend, or range.
- Spot Key Levels: Move to an intermediate timeframe (4-hour or 1-hour) to map out major support and resistance zones.
- Refine Entries/Exits: Drop down to your trading timeframe (often 1-hour, 30-minute, or even 15-minute) for precise trade execution aligned with your overall thesis.
This hierarchy helps ensure your trades are not just technically sound but also contextually aware. According to Wallmer’s guide on multiple time frames, this method boosts both win rate and confidence by keeping your trades in sync with dominant market forces.
Key Benefits of Multi-Timeframe Analysis in Crypto Trading
- Comprehensive Market Perspective: Multi-timeframe analysis provides traders with a holistic view of the market by examining price action across several intervals. This approach helps identify the primary trend, short-term fluctuations, and potential reversal points, reducing the risk of tunnel vision.
- Improved Entry and Exit Precision: By aligning trade entries and exits with signals from both higher and lower timeframes, traders can fine-tune their timing. This increases the likelihood of entering trades at optimal points and maximizing potential profits.

- Enhanced Risk Management: Analyzing multiple timeframes allows traders to spot key support and resistance zones, set more accurate stop-loss levels, and avoid trades that go against the dominant trend, thereby minimizing losses.
- Adaptability to Market Conditions: Multi-timeframe analysis helps traders adjust their strategies based on changing market dynamics, such as trend reversals or consolidations, leading to more informed and flexible decision-making.

- Reduced False Signals: Filtering trade setups through multiple timeframes helps confirm the validity of signals, decreasing the chances of reacting to market noise or misleading indicators on a single chart.
Best Practices for Effective MTFA
To get the most out of multi-timeframe analysis without falling into "analysis paralysis, " keep these tips front and center:
- Simplify Your Charting: Limit yourself to two or three timeframes. Too many can lead to conflicting signals and confusion.
- Use Consistent Indicators: Apply familiar tools like moving averages or RSI across all chosen timeframes so your signals are comparable.
- Avoid Overtrading: Don’t let lower timeframe noise override clear trends from higher intervals. Patience pays off when aligning entries with overall direction.
- Set Time Limits: Give yourself fixed periods for analysis per timeframe so you don’t get stuck second-guessing every move.
If you want more detail on structuring multi-timeframe analysis for crypto markets specifically, check out this comprehensive resource from The Crypto Cortex.
Real-World Example: Multi-Timeframe Analysis in Action
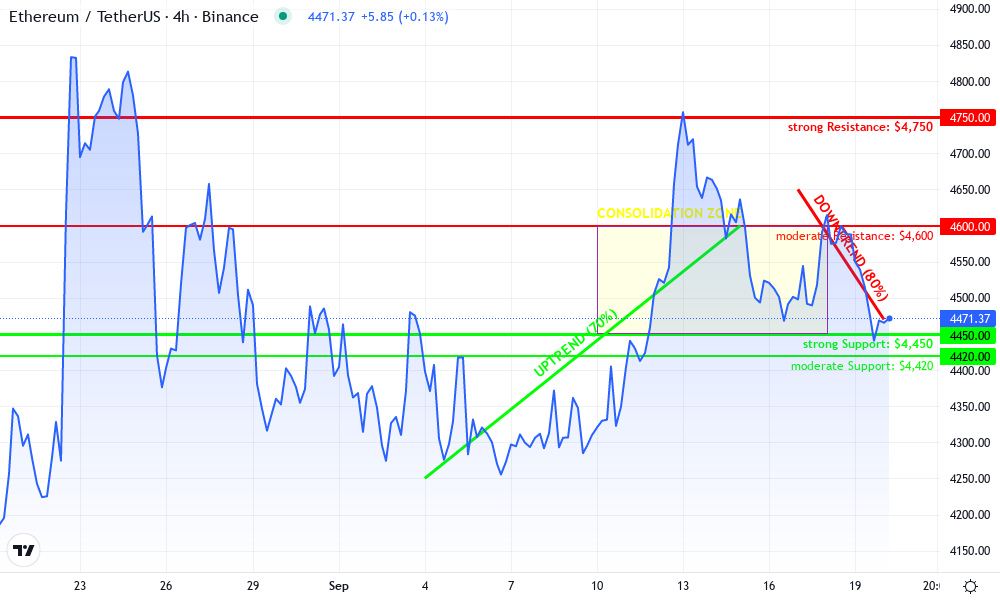
Let’s walk through a practical scenario. Suppose you’re watching Ethereum (ETH). On the daily chart, ETH is trending above its 50-day moving average, signaling bullish momentum. Shifting to the 4-hour chart, you spot a consolidation just below a key resistance level. Finally, on the 1-hour chart, a breakout candle forms with volume surging above recent averages. By layering these perspectives, you can enter with conviction when the lower timeframe confirms the higher timeframe’s bias, rather than reacting to every short-term swing.
Ethereum Technical Analysis Chart
Analysis by Samantha Leighton | Symbol: BINANCE:ETHUSDT | Interval: 1D | Drawings: 7
Technical Analysis Summary
Start by drawing a horizontal line at the current price level ($4470.26) to anchor the analysis. Plot a strong support line near $4450 (recent bounce zone) and a key resistance at $4750 (recent local high). Use a trend line to connect the recent higher lows from early September to mid-September, indicating a mild short-term uptrend before the latest pullback. Mark the consolidation range between $4450 and $4600 observed through mid-September. Highlight the breakdown from $4600 to $4450 as a short-term bearish signal. Add a text label noting the current market indecision around $4470, and consider a rectangle to capture the consolidation zone. For risk management, mark potential stop-loss below $4420 and profit target at $4600.
Tags
Related Articles

Trading MARA Stock with Bitcoin Hashrate Metrics: 2026 Guide
MARA Holdings stock sits at $11.18 right now, down 3.95% or -$0.46 in the last 24 hours, with a high of $11.74 and low of $11.085. Volatility like this screams opportunity for aggressive traders who know where to look. Bitcoin's network...
Apr 28, 2026
2026 $50 Crypto Stock Trading Challenge: Strategies for Small Accounts
In the volatile arena of 2026 crypto stock trading, turning a modest $50 account into a powerhouse demands precision over bravado. With Bitcoin hovering at $66,101.00 , down slightly by $1,565 in the last 24 hours, correlated stocks like...
Feb 19, 2026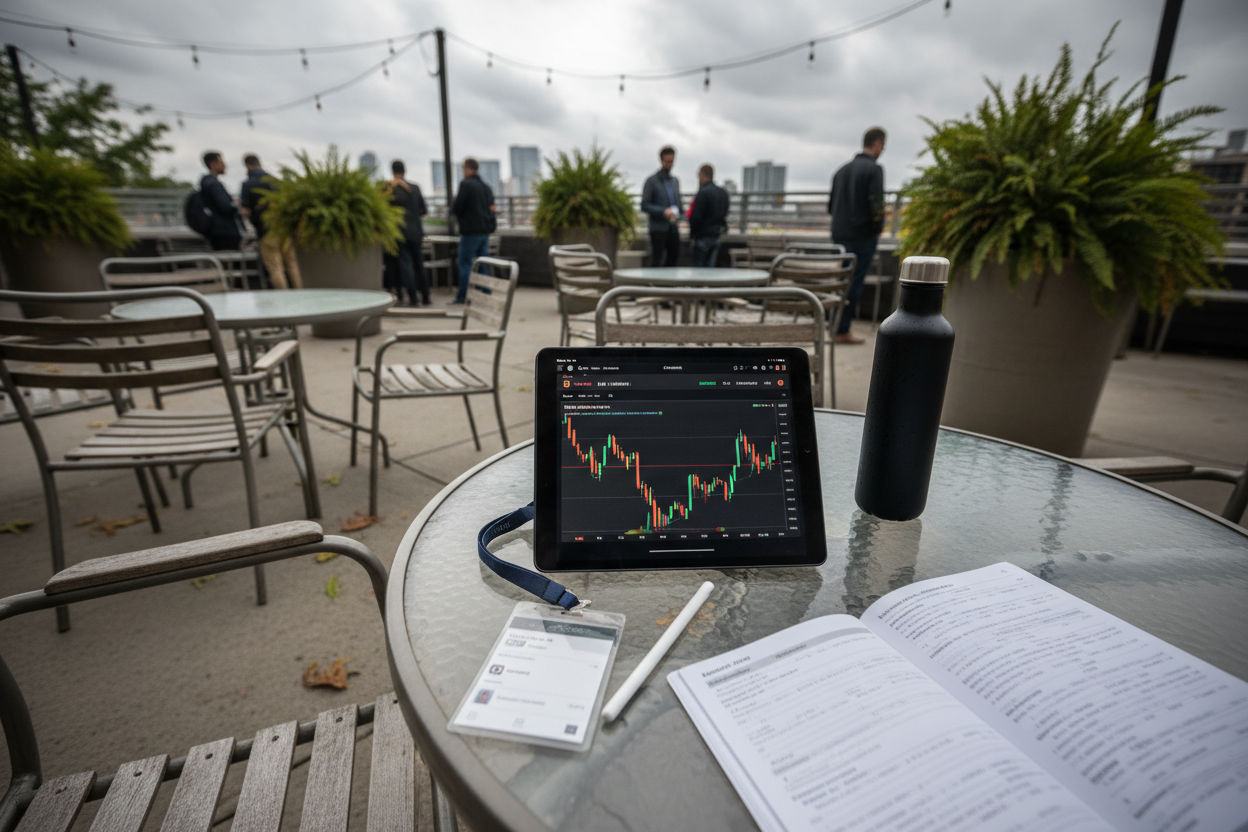
Trading Metaplanet Stock as Bitcoin Proxy During 67K Dips 2026 Guide
In the current market environment, with Bitcoin hovering at $67,908.00 after a modest 24-hour dip from a high of $69,999.00, investors seeking indirect exposure to BTC's movements are turning their attention to stocks like Metaplanet Inc....
Feb 17, 2026
Simple 2 EMA VWAP Strategy for Bitcoin Day Trading in Volatile Crypto Markets
Bitcoin's recent surge to $68,978.00, marking a 3.49% gain over the past 24 hours with a high of $69,123.00 and low of $65,148.00, underscores the volatility that defines crypto markets. Day traders face sharp swings, yet opportunities...
Feb 13, 2026
No comments yet. Be the first to share your thoughts!