
Institutional crypto accumulation is rewriting the playbook for digital asset markets in 2025. With Bitcoin (BTC) trading at $115,572.00, Ethereum’s premium surging on Coinbase, and Solana (SOL) rallying on whale inflows, the evidence is clear: institutions are not just participating, they are driving the next macro cycle. This influx of capital is reshaping volatility, liquidity, and ultimately, price discovery across the board.
Bitcoin Above $115,000: The New Institutional Battleground
The current BTC accumulation trend is underpinned by headline-grabbing treasury buys. Strategy’s latest purchase of 155 BTC at an average of $116,401 per coin brings their total to 628,946 BTC - a staggering show of confidence at these levels. Metaplanet’s recent acquisition of 518 BTC for $61.4 million further illustrates how deep-pocketed players are using every dip as an entry point (source).
This isn’t just about stacking coins for a rainy day. Institutional buyers are leveraging sophisticated execution strategies to minimize slippage and maximize stealth. The result? Daily trading volumes have soared 300% since 2020 while average price swings have compressed by 40%. Liquidity is deeper than ever - but so is the competition for prime entries.
"The era where whale moves dictated price action in isolation is fading; coordinated institutional flows now set the pace. "
Ethereum and Solana: Institutions Chase Yield Beyond Bitcoin
The narrative has shifted far beyond Bitcoin maximalism. ETH institutional trading is picking up steam as regulatory clarity improves and ETF flows ramp up. Aggressive spot buying through US exchanges has created a significant premium for Ethereum on Coinbase (source). This signals that funds and asset managers are positioning for long-term upside - especially with predictions of Ethereum reaching $5,200 by Q1 2026.
SOL accumulation has become another dominant theme. Whale wallets now hold over 1.51% of Solana’s supply ($1.83B), with monthly institutional inflows accelerating by 7% throughout Q3 2025 (source). Treasury firms scooping up millions of tokens underscore Solana’s appeal as an altcoin with both scalability and network effects.
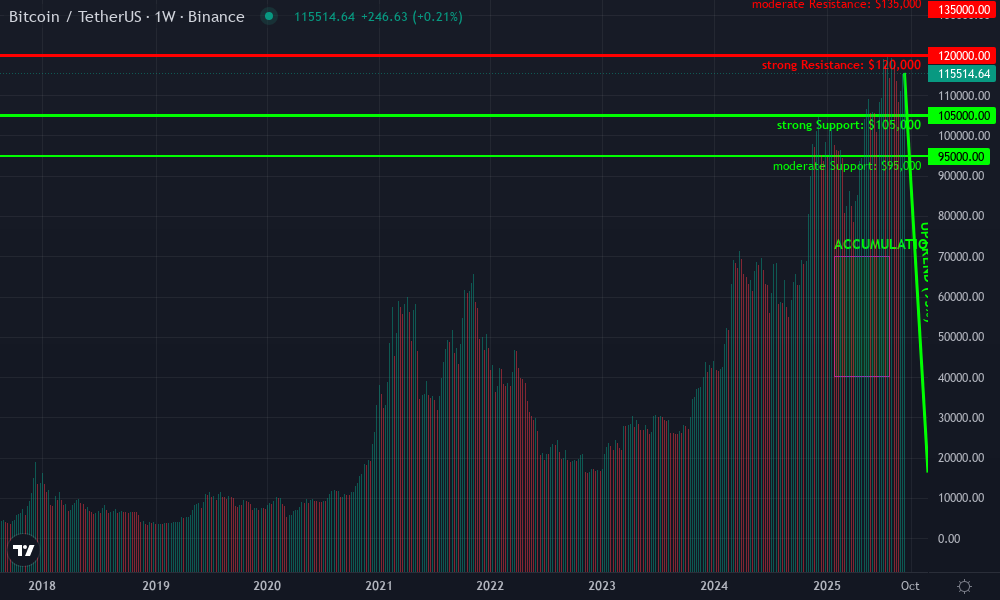
Bitcoin Technical Analysis Chart
Analysis by Owen Sanderson | Symbol: BINANCE:BTCUSDT | Interval: 1W | Drawings: 6
Technical Analysis Summary
Draw the primary uptrend line from the local low around $16,000 in late 2022 to the current region above $115,000 in September 2025. Mark horizontal resistance at $120,000 and support at $105,000 and $95,000. Highlight the consolidation region in Q2-Q3 2025 between $105,000 and $117,000. Annotate the recent volume surge supporting the uptrend. Use a long position tool for potential entries near $110,000 with a stop below $105,000, and note profit targets at $120,000 and $135,000 (upper analyst consensus). Use text/callouts at major levels and arrows to mark breakout attempts.
Risk Assessment: medium
Analysis: While trend and volume are strong, price is near all-time highs and extended from prior bases. Institutional support below $105,000 is robust, but caution warranted for potential sharp corrections as cycle matures.
Owen Sanderson's Recommendation: Accumulate on dips near $110,000–$105,000, use protective stops below $95,000, and scale out profits into strength above $120,000. Watch for momentum shifts and be nimble if volatility returns.
Key Support & Resistance Levels
📈 Support Levels:
- $105,000 - Recent multi-week support zone, prior consolidation before latest leg higher. strong
- $95,000 - Major psychological and technical support from prior breakout. moderate
📉 Resistance Levels:
- $120,000 - Current all-time high region, tested twice in 2025. strong
- $135,000 - Analyst target and round-number resistance. moderate
Trading Zones (medium risk tolerance)
🎯 Entry Zones:
- $110,000 - Pullback entry at top of previous consolidation, aligning with institutional bid clusters. medium risk
- $105,000 - Major support, optimal for higher conviction long entries. low risk
🚪 Exit Zones:
- $120,000 - First profit target at resistance/all-time high. 💰 profit target
- $135,000 - Secondary profit target, aligns with published analyst consensus. 💰 profit target
- $95,000 - Protective stop loss below major support if trend fails. 🛡️ stop loss
Technical Indicators Analysis
📊 Volume Analysis:
Pattern: Sustained volume increase since late 2024, supporting the bullish advance and confirming institutional participation.
Volume has expanded notably during the 2025 rally, validating the uptrend and indicating strong hands are in control.
📈 MACD Analysis:
Signal: Bullish, but risk of overextension.
While not shown directly, MACD would likely show strong positive momentum but with possible early signs of flattening—watch for divergences on further highs.
Applied TradingView Drawing Utilities
This chart analysis utilizes the following professional drawing tools:
Disclaimer: This technical analysis by Owen Sanderson is for educational purposes only and should not be considered as financial advice. Trading involves risk, and you should always do your own research before making investment decisions. Past performance does not guarantee future results. The analysis reflects the author's personal methodology and risk tolerance (medium).
Spotting Institutional Accumulation: Signals That Matter
Catching these moves in real time requires more than watching headlines; traders need actionable signals:
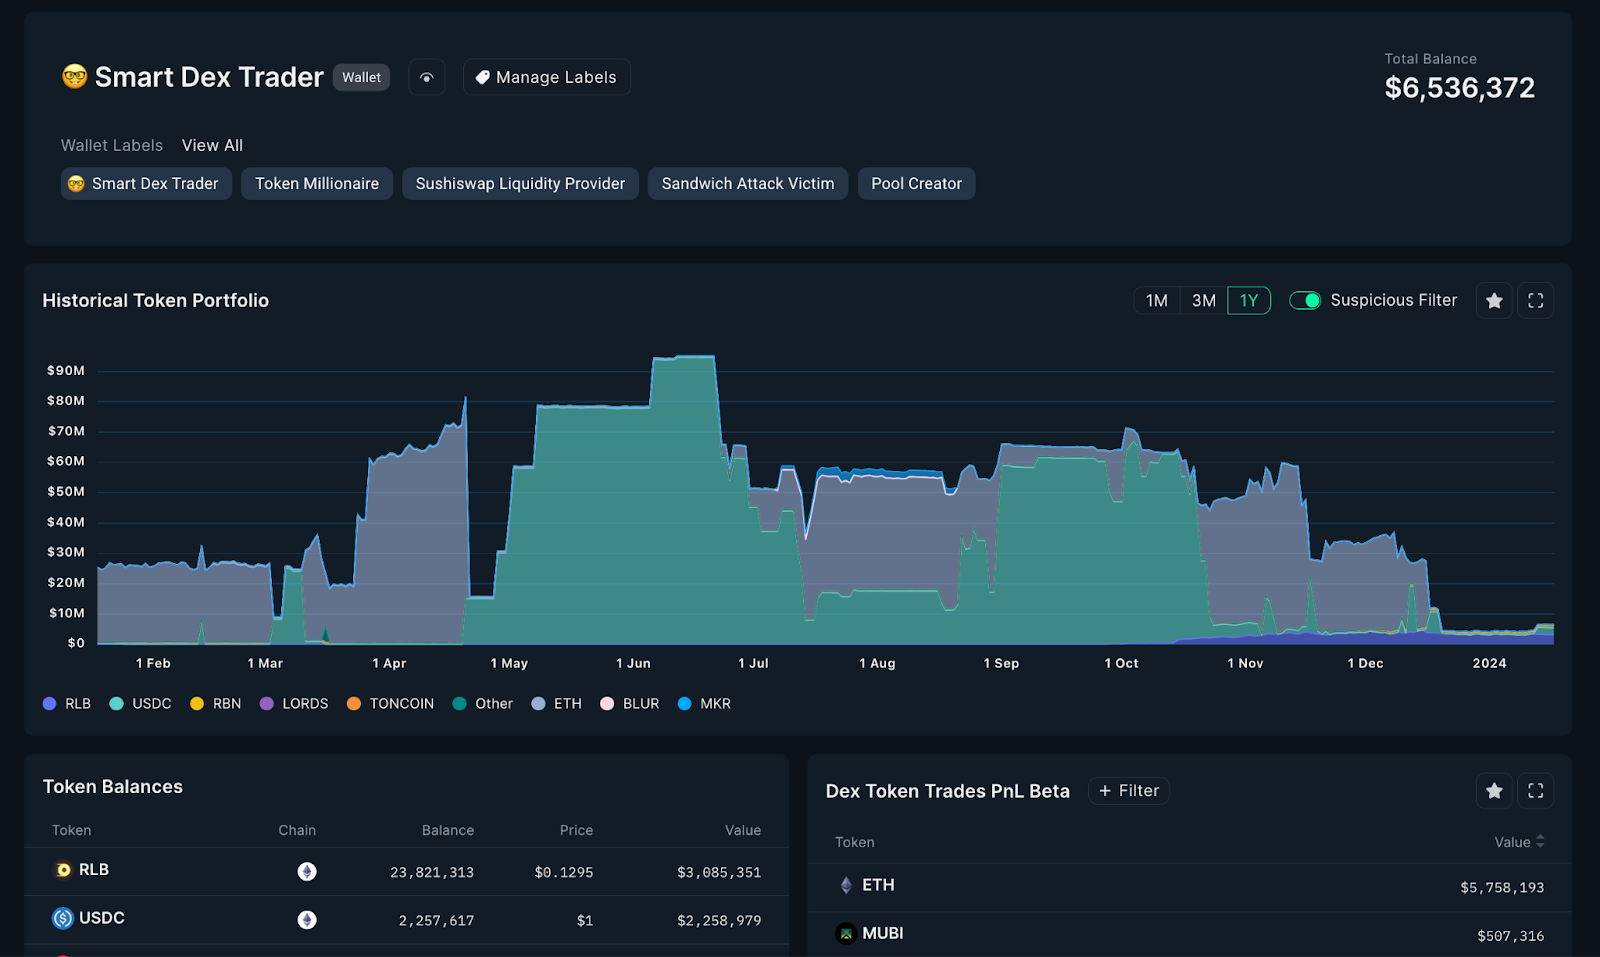
- On-chain wallet analysis: Track large transactions and rising numbers of wallets holding between 1,000 to 10,000 BTC or their ETH/SOL equivalents (source). These clusters often precede major rallies.
- CEX order book imbalances: Sudden shifts in buy-side depth or hidden bids can reveal ongoing accumulation before public news breaks.
- Bullish ETF flows: Watch for spikes in net inflows into crypto ETFs - especially those managed by giants like BlackRock or Fidelity.
- Cohesive market structure: Reduced volatility coupled with steady upward price drift typically signals smart money at work rather than retail FOMO.
Bitcoin (BTC) Price Prediction 2026-2031: Institutional Accumulation & Market Scenarios
Forecasts based on current trends, institutional activity, and expert analysis as of September 2025
| Year | Minimum Price | Average Price | Maximum Price | % Change (Avg YoY) | Scenario Insights |
|---|---|---|---|---|---|
| 2026 | $105,000 | $130,000 | $155,000 | +12.5% | Fed rate cuts and ETF inflows support price; volatility remains as altcoins gain traction |
| 2027 | $112,000 | $145,000 | $180,000 | +11.5% | Continued institutional accumulation, but increased regulatory scrutiny and ETH/SOL competition |
| 2028 | $120,000 | $162,000 | $210,000 | +11.7% | Mainstream adoption growth, potential for Bitcoin upgrades (e.g., scalability improvements) |
| 2029 | $130,000 | $180,000 | $245,000 | +11.1% | Cycle peak possible; global macroeconomic shifts impact capital inflows |
| 2030 | $140,000 | $200,000 | $285,000 | +11.1% | Wider use cases (e.g., settlement rails), increased adoption in emerging markets |
| 2031 | $150,000 | $222,000 | $330,000 | +11.0% | Mature institutional market, competition from CBDCs and advanced altcoins |
Price Prediction Summary
Bitcoin is projected to experience steady growth from 2026 through 2031, driven by ongoing institutional accumulation, ETF adoption, and improving regulatory clarity. While altcoin competition and macroeconomic factors may introduce volatility, the long-term trend is upward, with average prices more than doubling by 2031 compared to 2025. Bullish scenarios reflect continued global adoption and technological advances, while bearish cases consider possible regulatory setbacks and capital shifts toward alternative assets.
Key Factors Affecting Bitcoin Price
- Institutional accumulation (treasury and ETF flows)
- Regulatory developments (clarity, restrictions, or support)
- Macro trends (Fed policy, global economic cycles)
- Technological improvements (scalability, security)
- Adoption by corporations and nations
- Competition from Ethereum, Solana, and CBDCs
- Market sentiment and cyclical investor behavior
Disclaimer: Cryptocurrency price predictions are speculative and based on current market analysis. Actual prices may vary significantly due to market volatility, regulatory changes, and other factors. Always do your own research before making investment decisions.
The interplay between these signals offers traders a powerful edge - if they know where to look and how to interpret what they see.
For market participants, the implications of institutional crypto accumulation are profound. Not only do these flows create new price floors, but they also change the rhythm of volatility and liquidity cycles. When BlackRock or a major treasury desk enters the market, their activity is often spread over days or weeks, camouflaged by algorithmic execution and deep liquidity pools. This can make it difficult for retail traders to spot accumulation in real-time, but not impossible for those leveraging the right analytical tools.

Trading With The Giants: How to Align Your Strategy
To capitalize on the current BTC accumulation trend, traders should focus on aligning their entries with institutional footprints rather than chasing short-term hype. Here are some actionable approaches:
Top Institutional Crypto Trading Strategies for 2025
- On-Chain Data Monitoring: Institutions track large wallet movements and blockchain transactions to identify accumulation trends. For example, a surge in wallets holding 1,000 to 10,000 BTC often signals significant institutional buying activity, helping traders anticipate market moves.
- Algorithmic Trading Execution: Leading funds use sophisticated algorithmic trading platforms like Coinbase Prime and Binance Institutional to execute large orders with minimal slippage, optimizing for speed and price efficiency in volatile markets.
- Trend-Following Strategies: Institutions leverage advanced analytics tools such as Token Metrics and Glassnode to identify and ride prevailing market trends, using momentum and sentiment analysis to inform entry and exit points.
- Risk Management Protocols: Robust risk controls are essential. Institutions employ stop-loss and take-profit orders, often using platforms like Kraken Institutional, to maintain strict risk-to-reward ratios (e.g., 1:3), protecting capital during market swings.

- ETF and Regulated Product Flows: With the launch of spot Bitcoin and Ethereum ETFs, institutions increasingly allocate capital through regulated products, enhancing liquidity and transparency. Monitoring ETF inflows and outflows offers critical insight into institutional sentiment.

- Shadow Large Wallets: Use blockchain explorers and analytics platforms to track movements of wallets associated with funds or corporate treasuries. If you notice persistent buying at key levels (like BTC’s current $115,572.00), it’s a strong signal of accumulation.
- Follow ETF Flow Data: Monitor daily net inflows into major crypto ETFs and ETPs. Spikes often precede or coincide with breakout moves in spot prices.
- Diversify Across Leaders: Don’t just watch Bitcoin. Ethereum’s institutional demand is rising rapidly, especially as ETF flows accelerate, and Solana’s whale-driven rally suggests a broader appetite for scalable altcoins.
- Leverage Trend-Following Algorithms: Institutions rely on systematic strategies that identify momentum shifts early; retail traders can replicate this edge using algorithmic trading bots tuned to volume and price trend triggers.
This approach isn’t about front-running whales, it’s about riding the same macro waves they’re creating. With daily volumes up 300% since 2020 and volatility compressed by 40%, there’s more opportunity than ever to trade alongside smart money rather than against it (source).
Risk Management in a Macro-Driven Market
No matter how bullish the institutional flows look, robust risk management remains non-negotiable. The presence of large players can dampen sudden downside moves but doesn’t eliminate risk entirely, especially if macroeconomic conditions shift or regulatory headlines spook markets. As institutions accumulate at scale, they also deploy sophisticated hedging strategies; retail traders should mirror this discipline by setting clear stop-losses and maintaining healthy risk-to-reward ratios.
The smartest money in crypto isn’t just buying dips, they’re managing every position as part of a bigger portfolio play.
Which crypto asset do you think institutions will accumulate most in Q4 2025?
Institutional investors are ramping up their crypto holdings, with recent data showing strong accumulation in Bitcoin (BTC) at $115,572, Ethereum (ETH) with aggressive spot buying, and Solana (SOL) gaining momentum. Based on the latest trends, which asset do you believe will see the most institutional accumulation next quarter?
The bottom line? With BTC holding $115,572.00, Ethereum surging on institutional premium, and Solana’s whale wallets growing monthly, we’re witnessing a new phase where macro trends drive not just price, but participation itself. Traders who learn to read these signals stand to benefit from deeper liquidity and more predictable cycles than ever before.


No comments yet. Be the first to share your thoughts!